

Chocolate is a delectable treat made from the roasted seeds of the cacao tree. Cacao trees thrive in tropical rainforests, where they require high humidity, abundant rainfall, nutrient-rich soil, and protection from strong winds to grow properly. Due to these strict growing requirements, cacao trees can only be cultivated within a narrow band of the earth's equator, which spans approximately 20 degrees and is known as the "cocoa belt".
This project aims to challenge the preconceptions of how the cocoa belt is traditionally visualized as a simple belt across a world map. Instead, I aim to create a new visual representation of the cocoa belt that is both creative and interactive. I hope to provide a memorable experience on the cocoa industry and spark curiosity and interest in the topic.
Data Source:
Inspiration
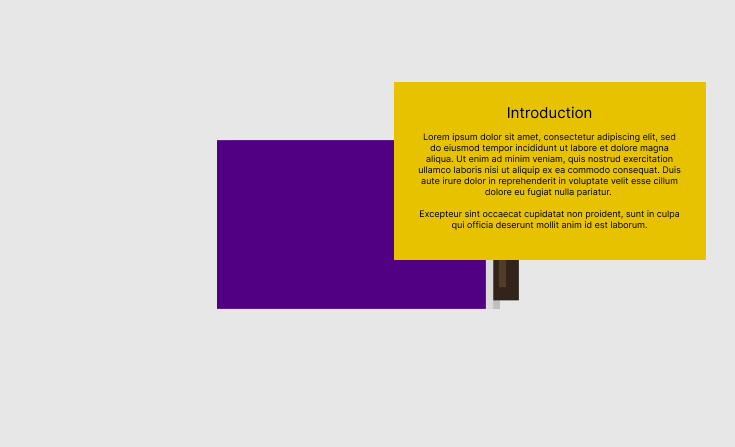
The design of this project was inspired by the iconic "golden ticket" from the 2015 film, Charlie and the Chocolate Factory. The concept was to create an interactive experience that would capture the attention of the audience and encourage them to engage with the content.
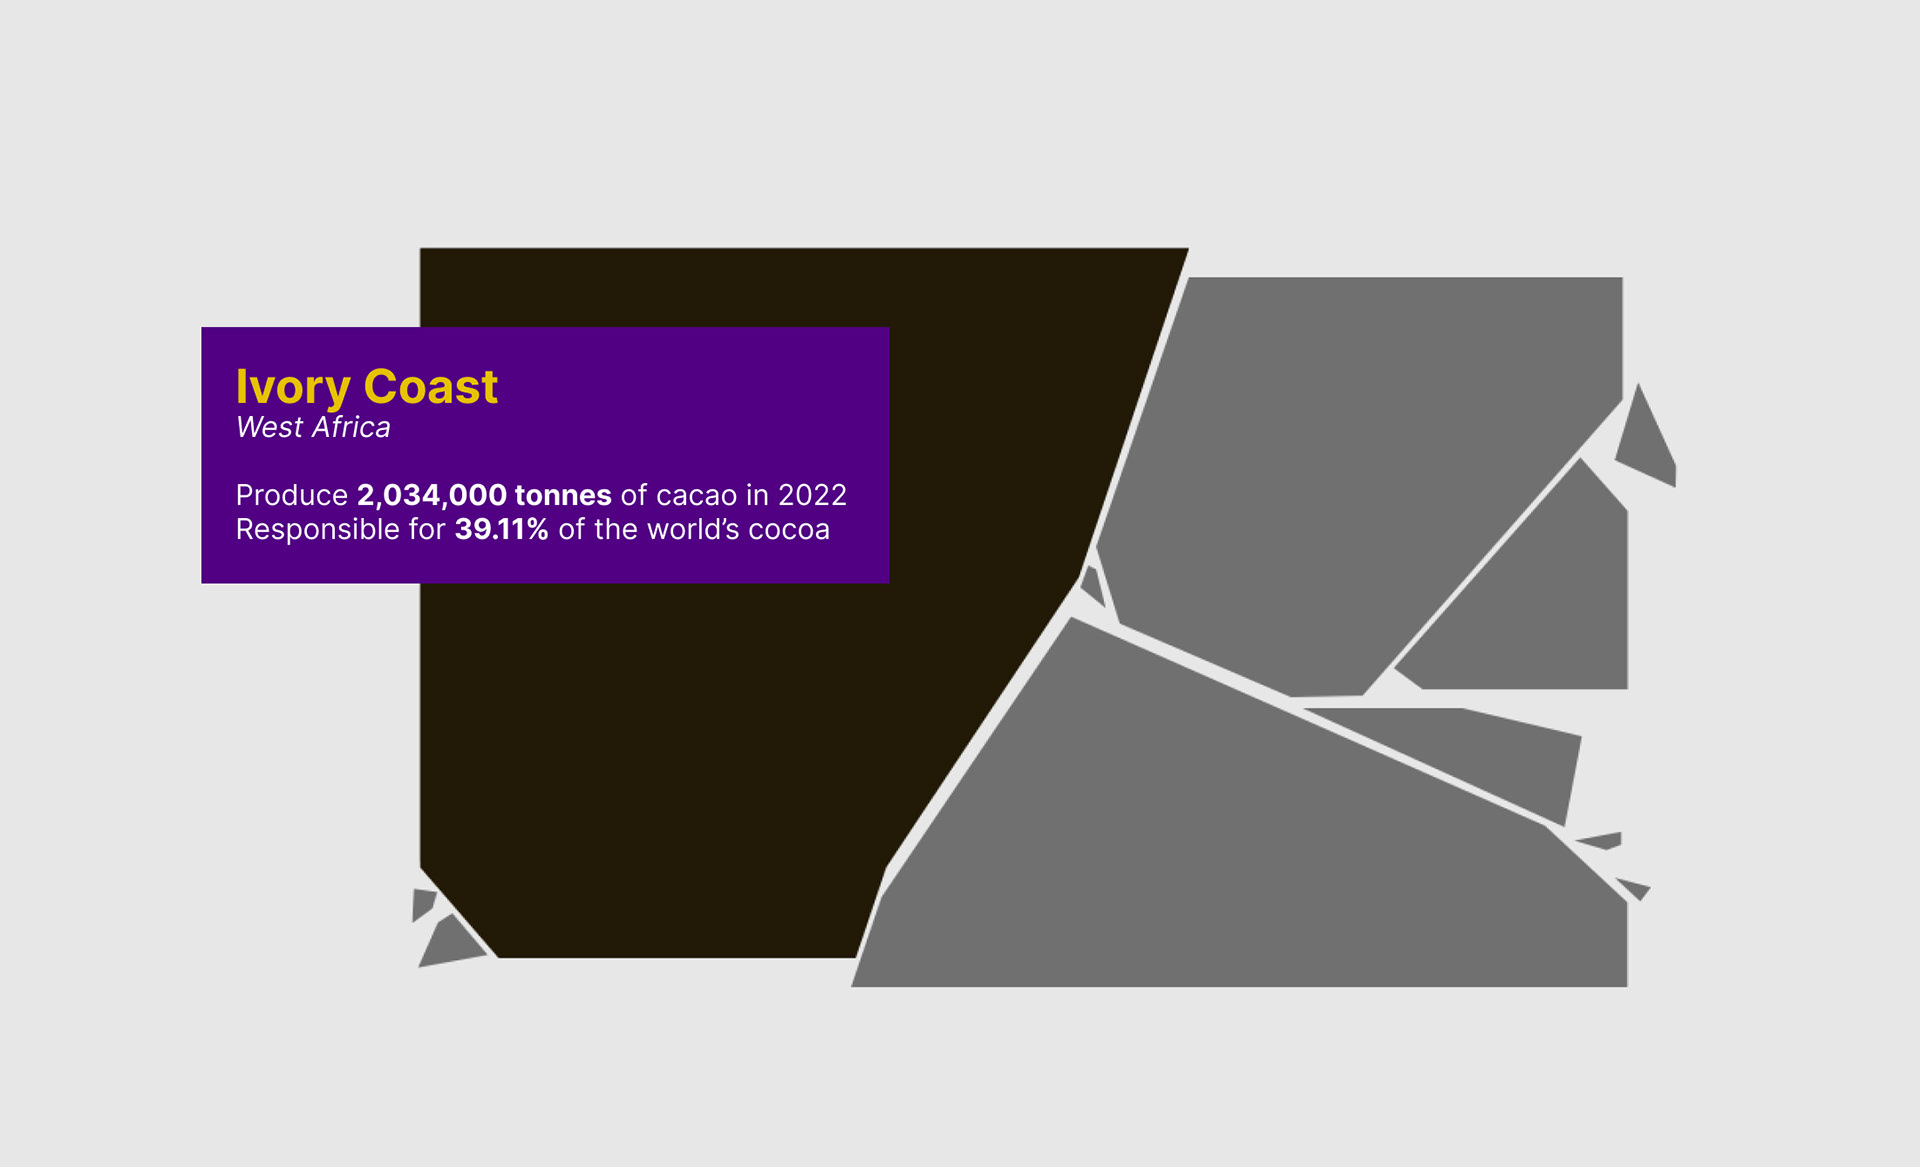
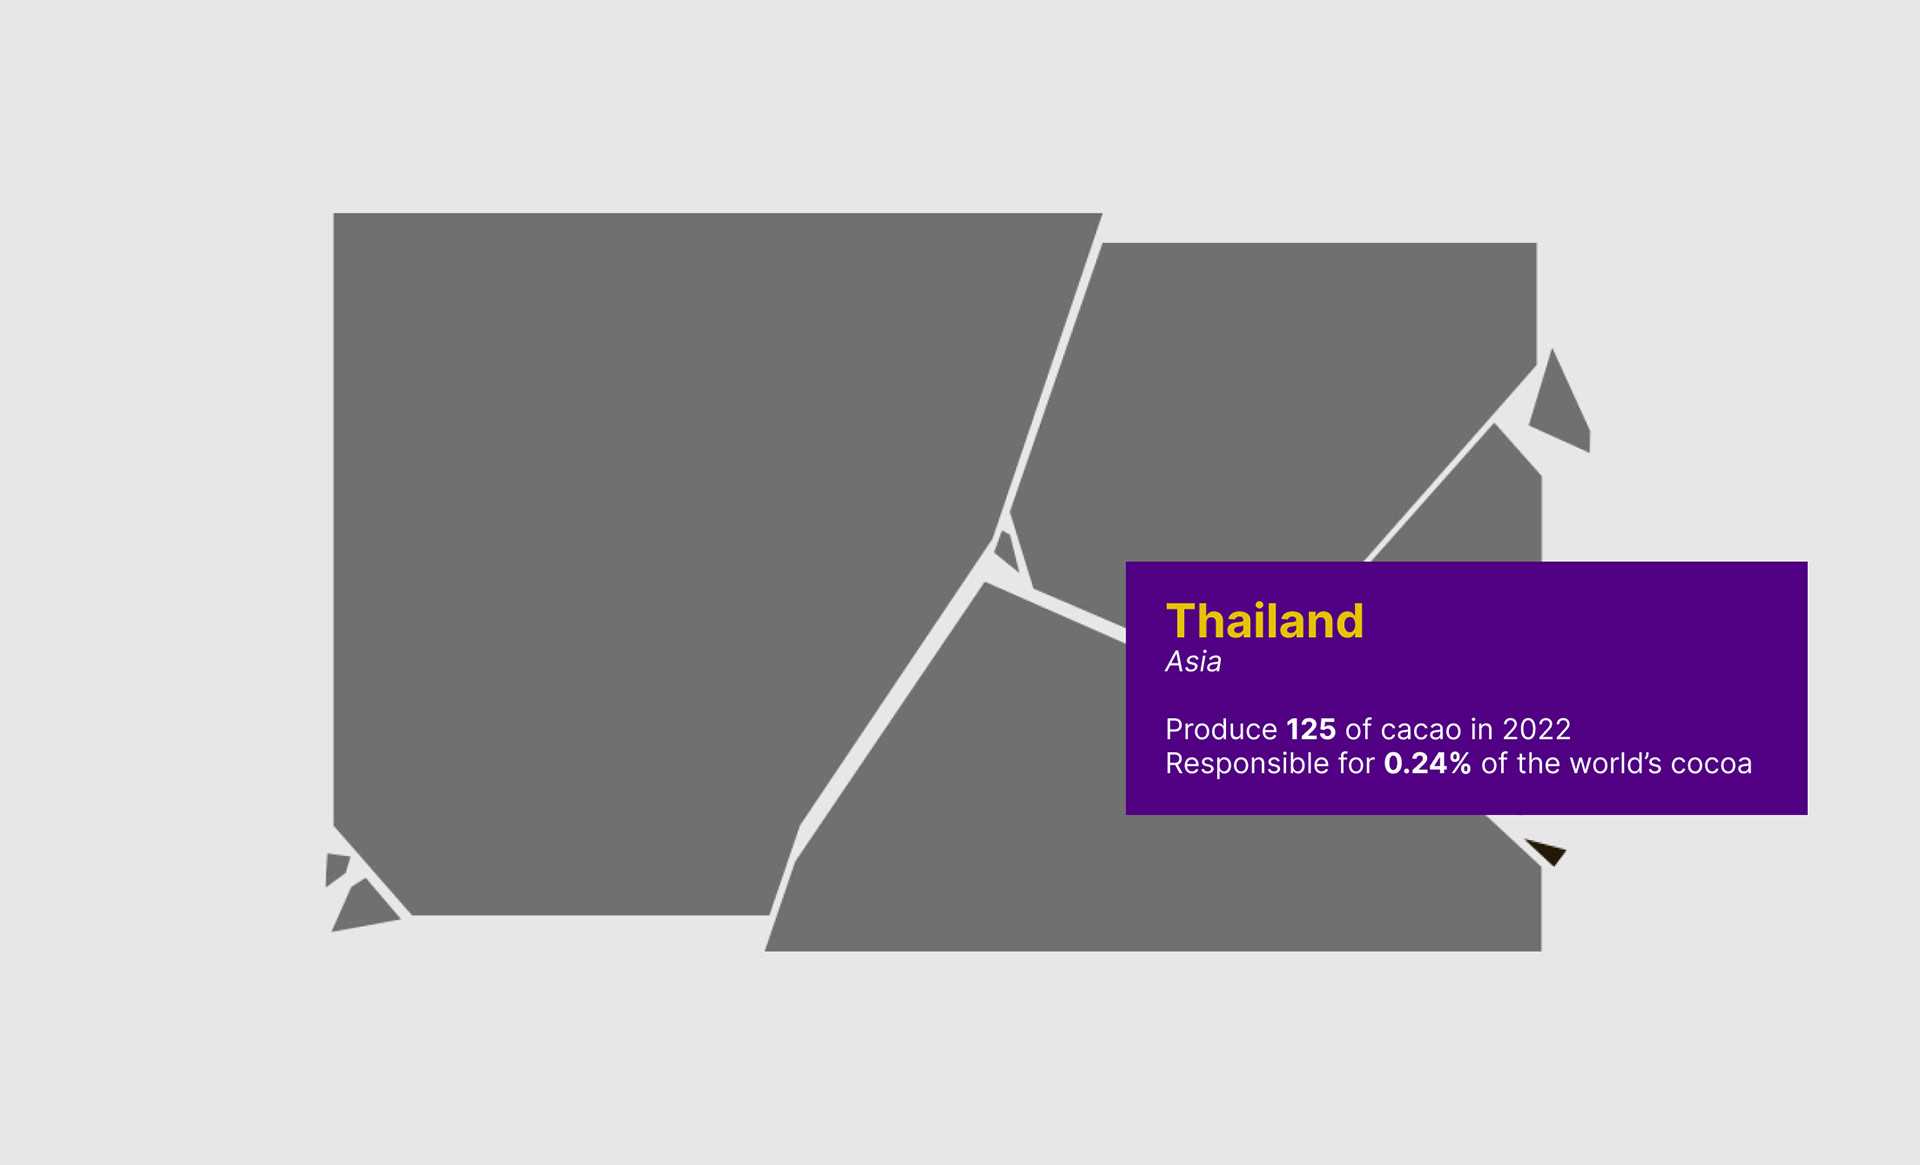
The homepage features a chocolate bar with a moving golden ticket, which prompts the user to click on it. Upon clicking, the ticket comes to the front of the screen and introduces the project. As the user scrolls down, they are presented with a chocolate bar that can be broken into pieces by clicking on it. Each of these pieces represents a cocoa-producing country and is linked to relevant data points. Users can hover over each segment to see more information about the producing country, such as its name, region, the amount of cacao it produces in tonnes, and its contribution to the world's cocoa supply.
This work is a part of MS Data Visualisation course at Parson school of Design - fall semester 2022.