
There are over 41,000 species worldwide currently facing the threat of extinction due to both human and natural factors. While the World Wildlife Fund (WWF) collaborates with the United Nations to protect 93 endangered species and address global threats, this project focuses on 48 endangered land animals in line with the UN Sustainable Development Goal 15: Life on Land. The project aims to provide the audience with a better understanding of the identity of each species, including their habitats, conservation status, and the threats they are facing.
Data Sources
• Raw data
Designing SVGs
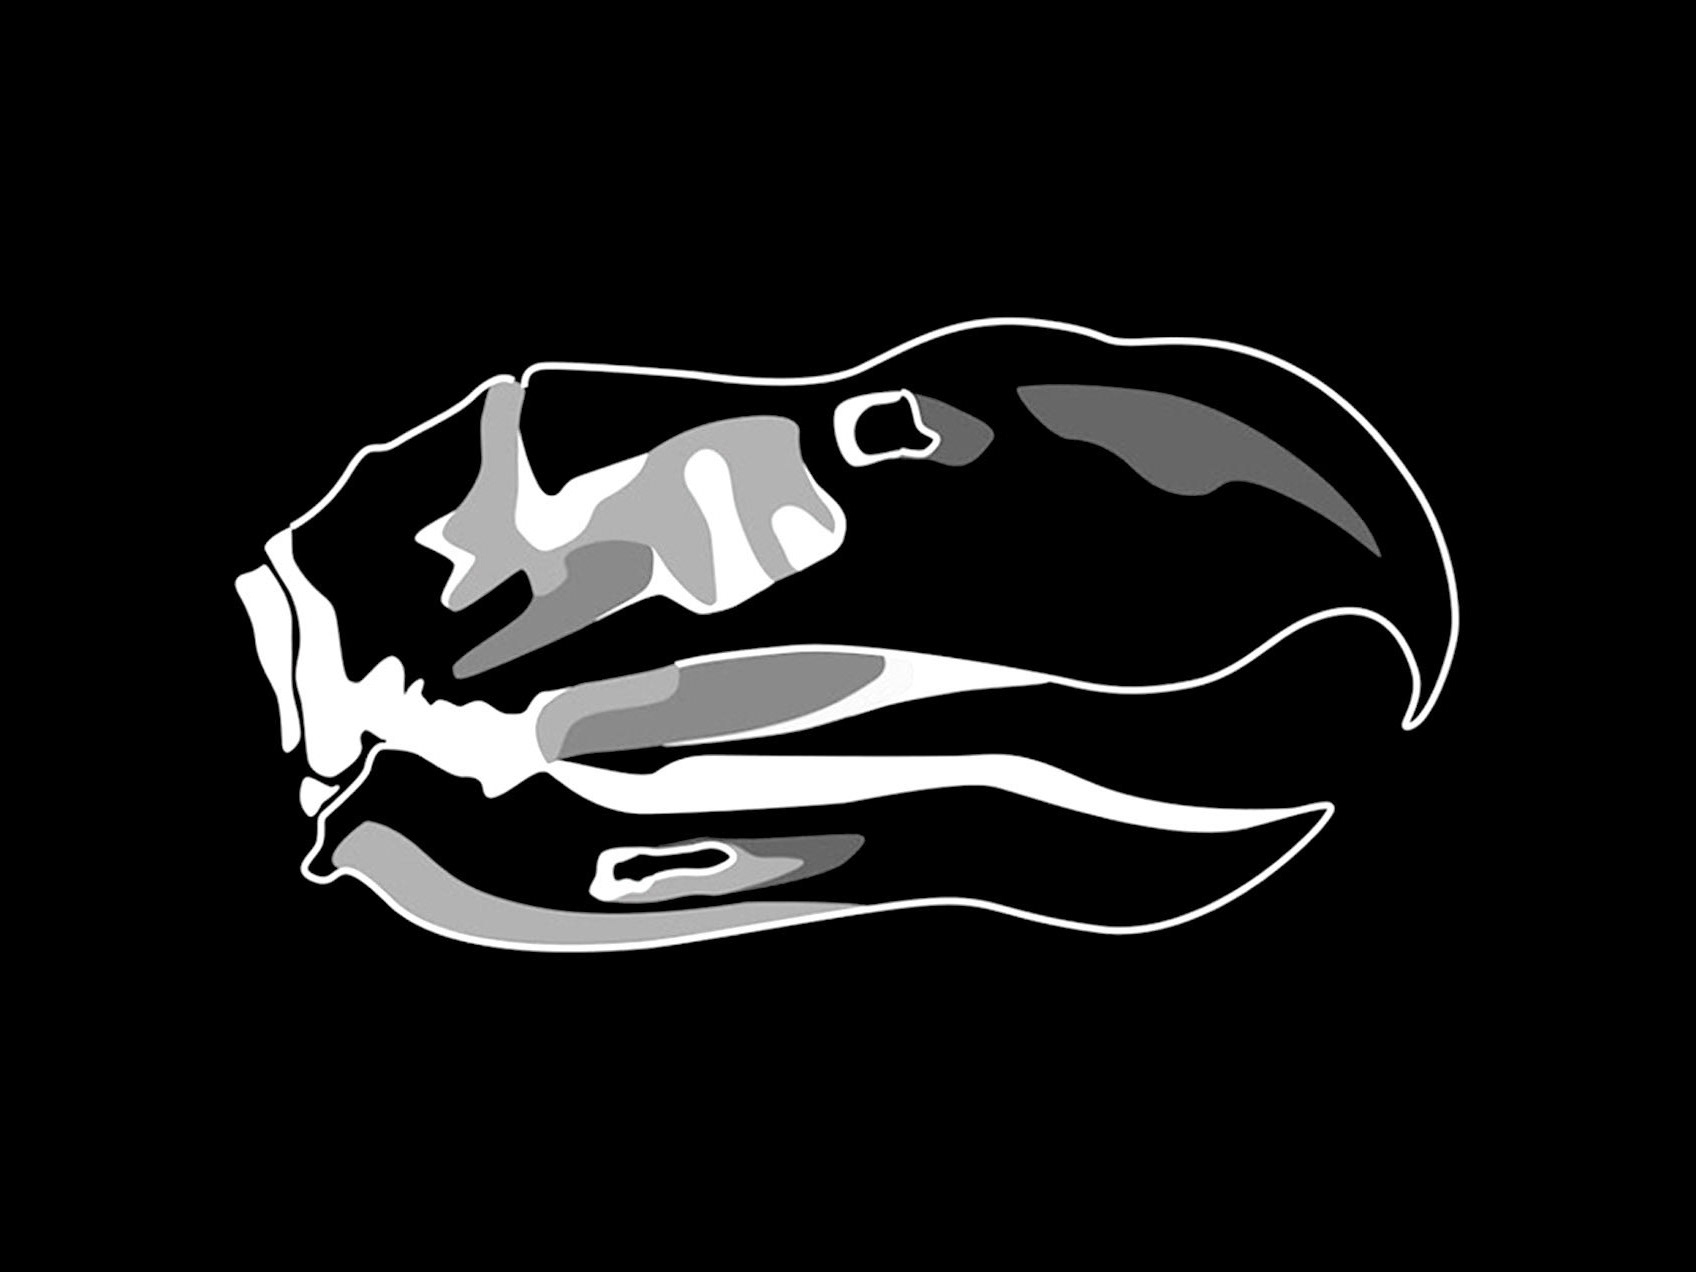
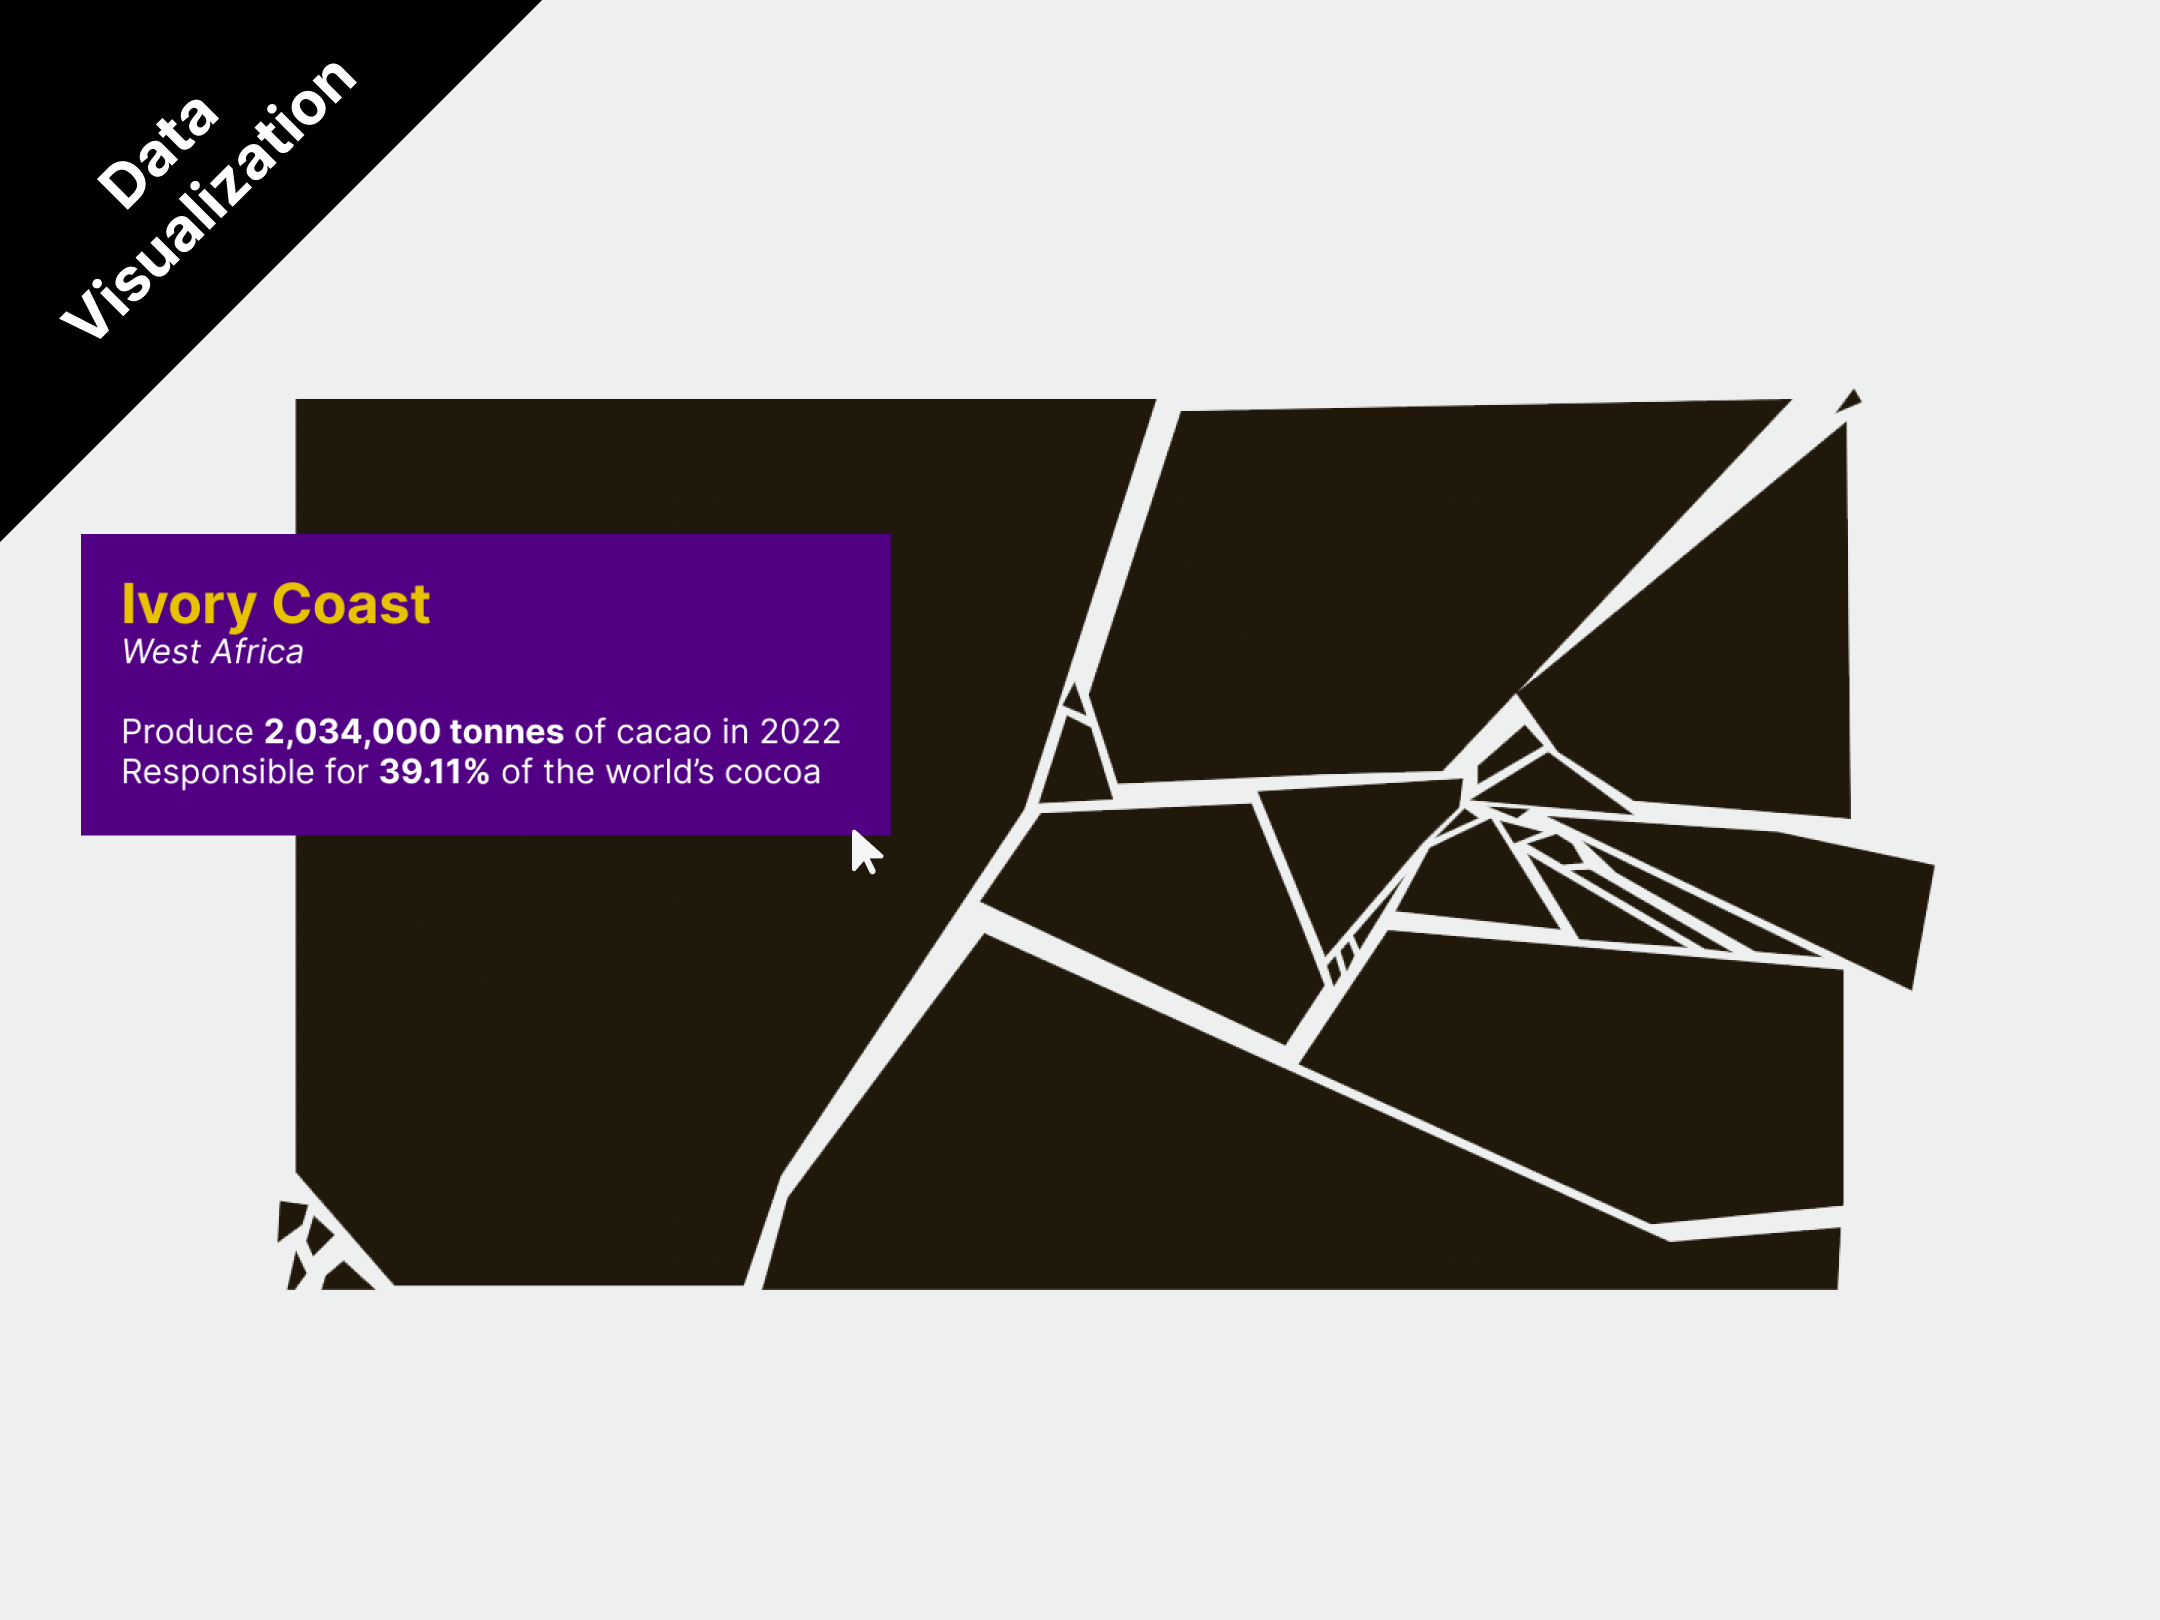
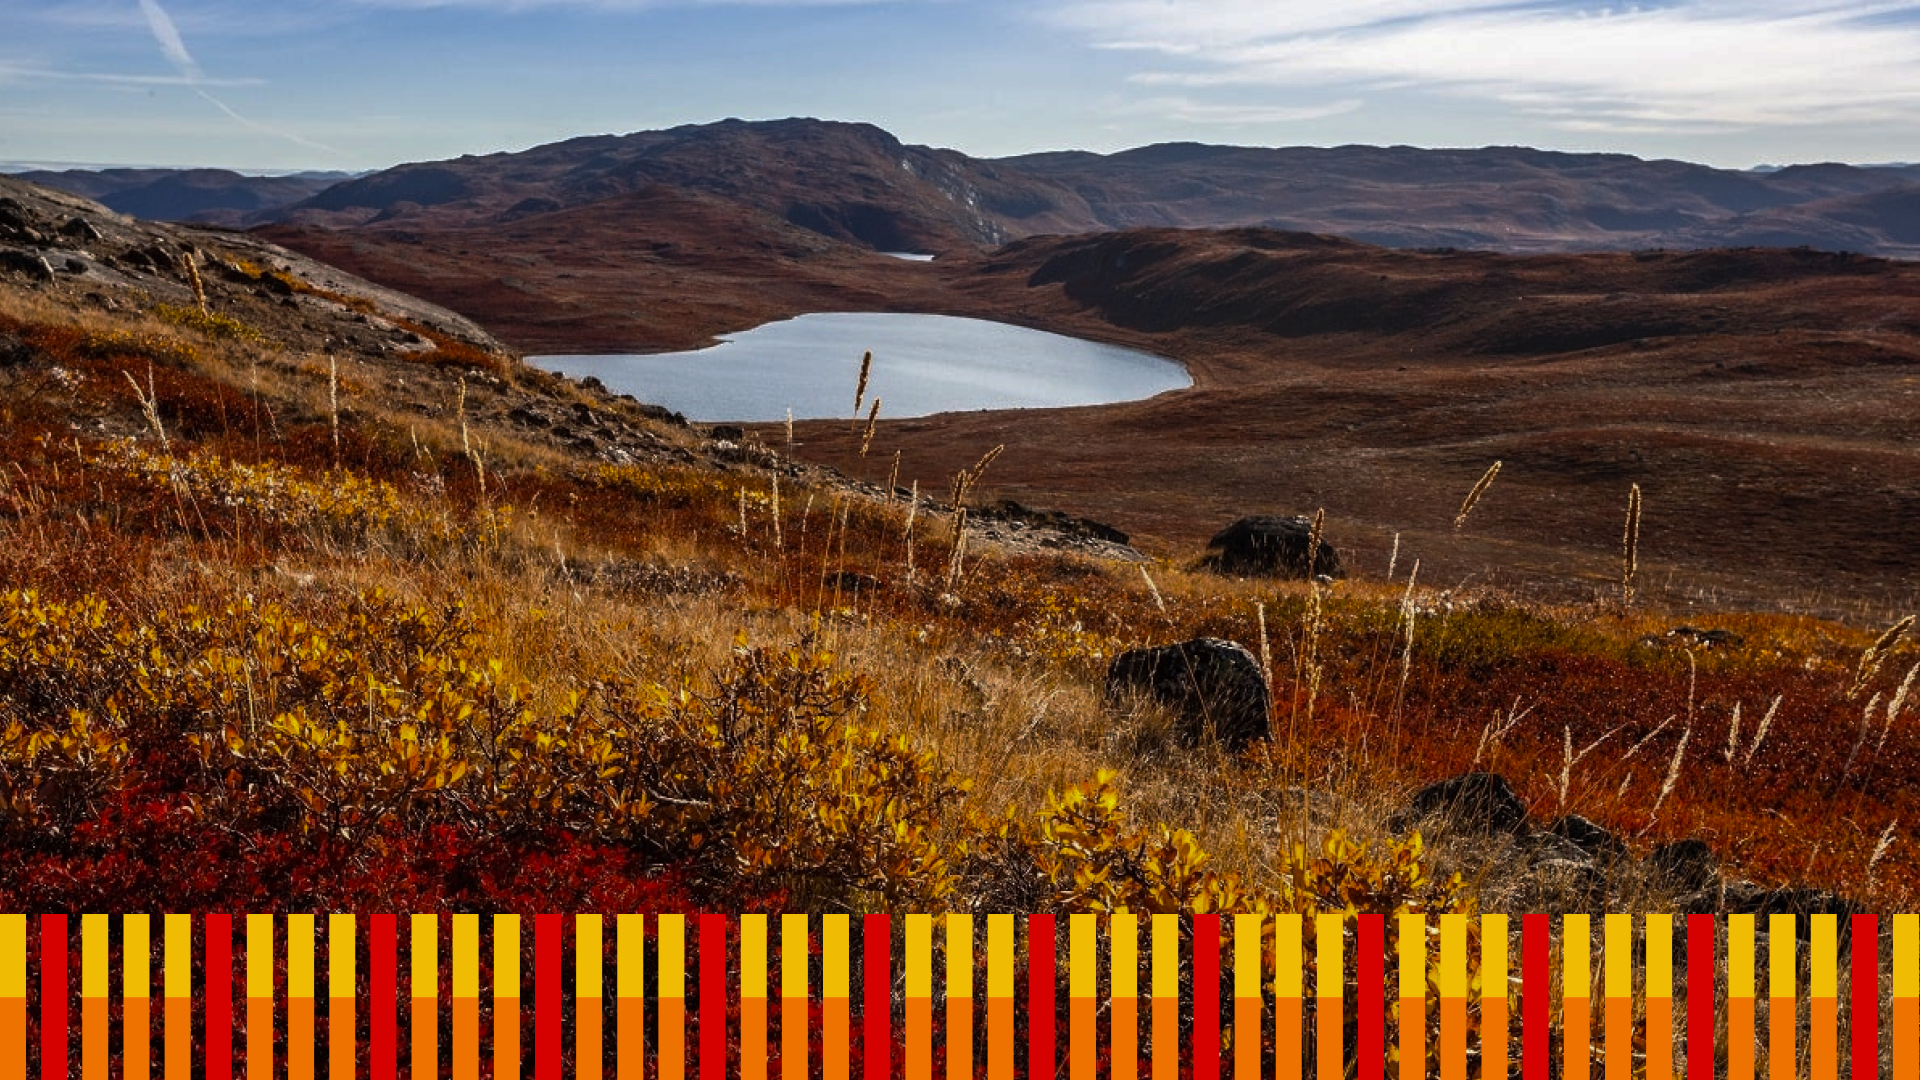
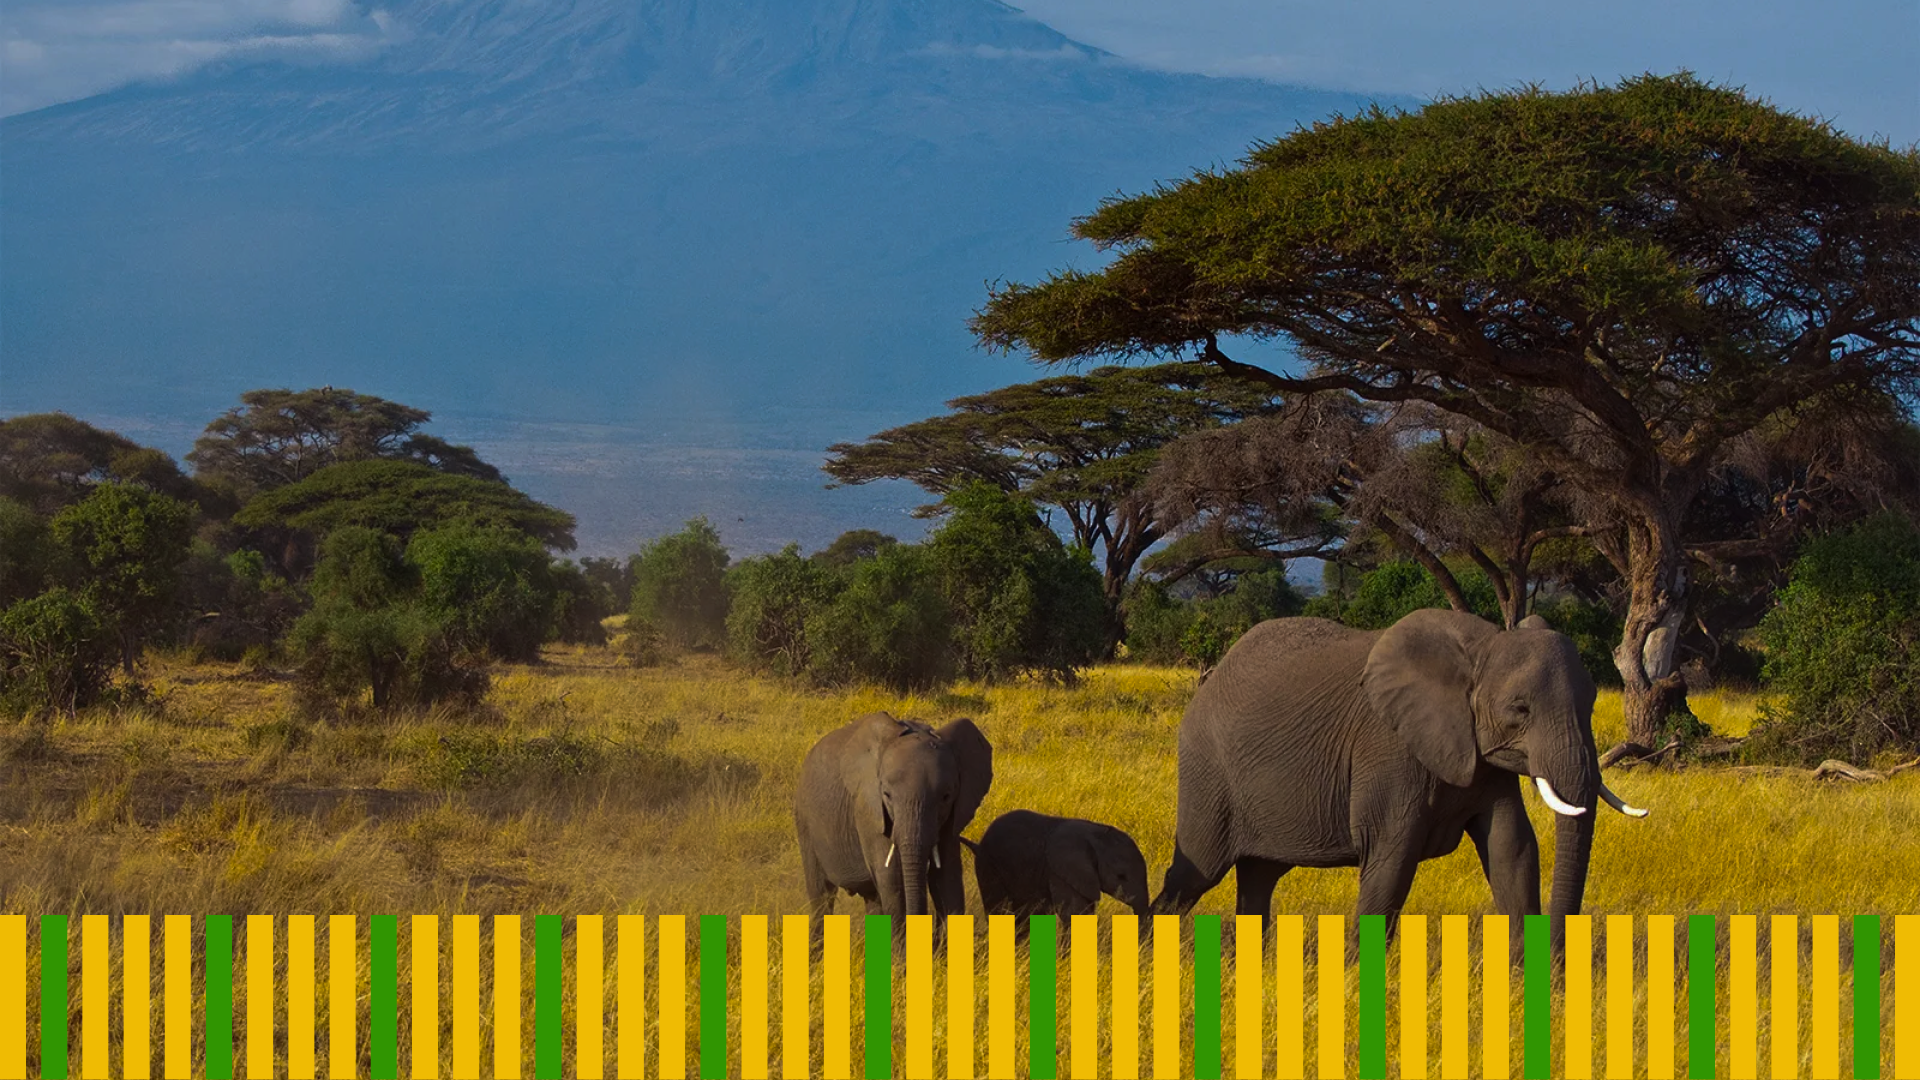
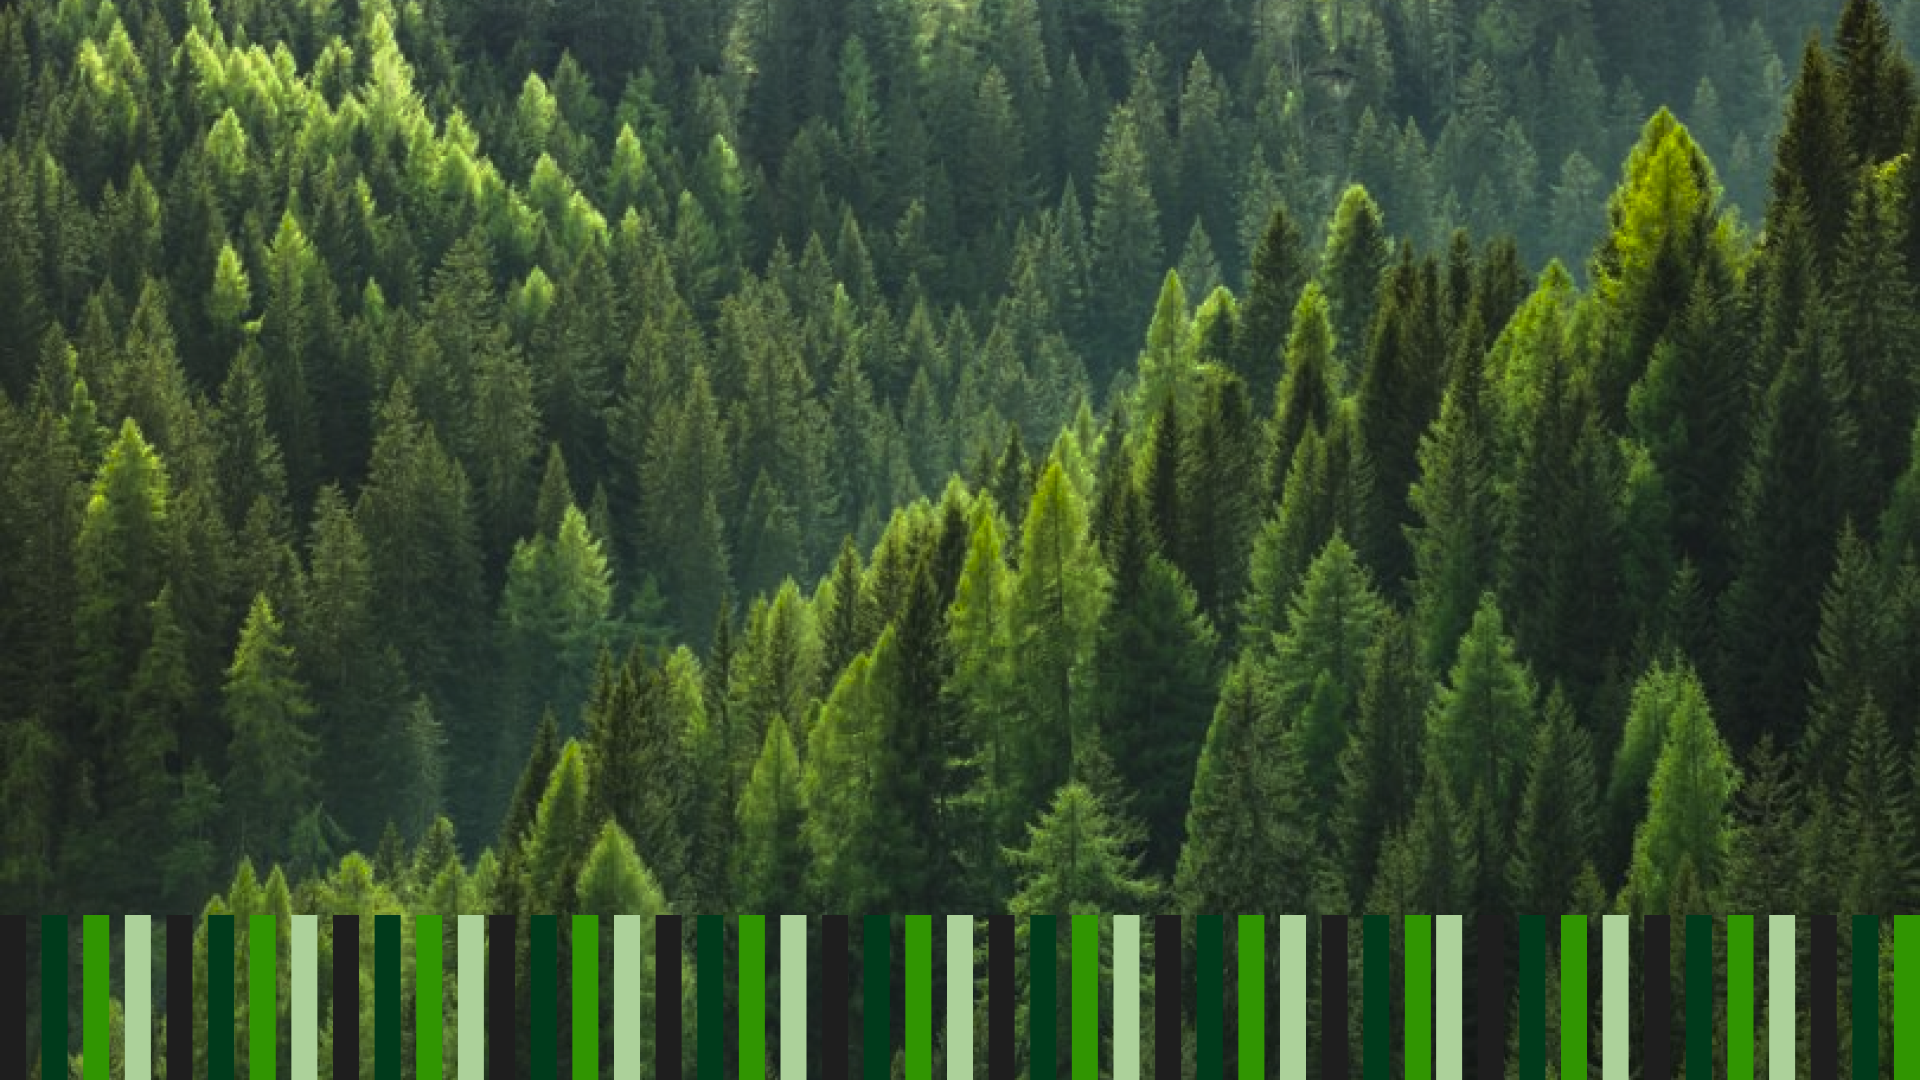
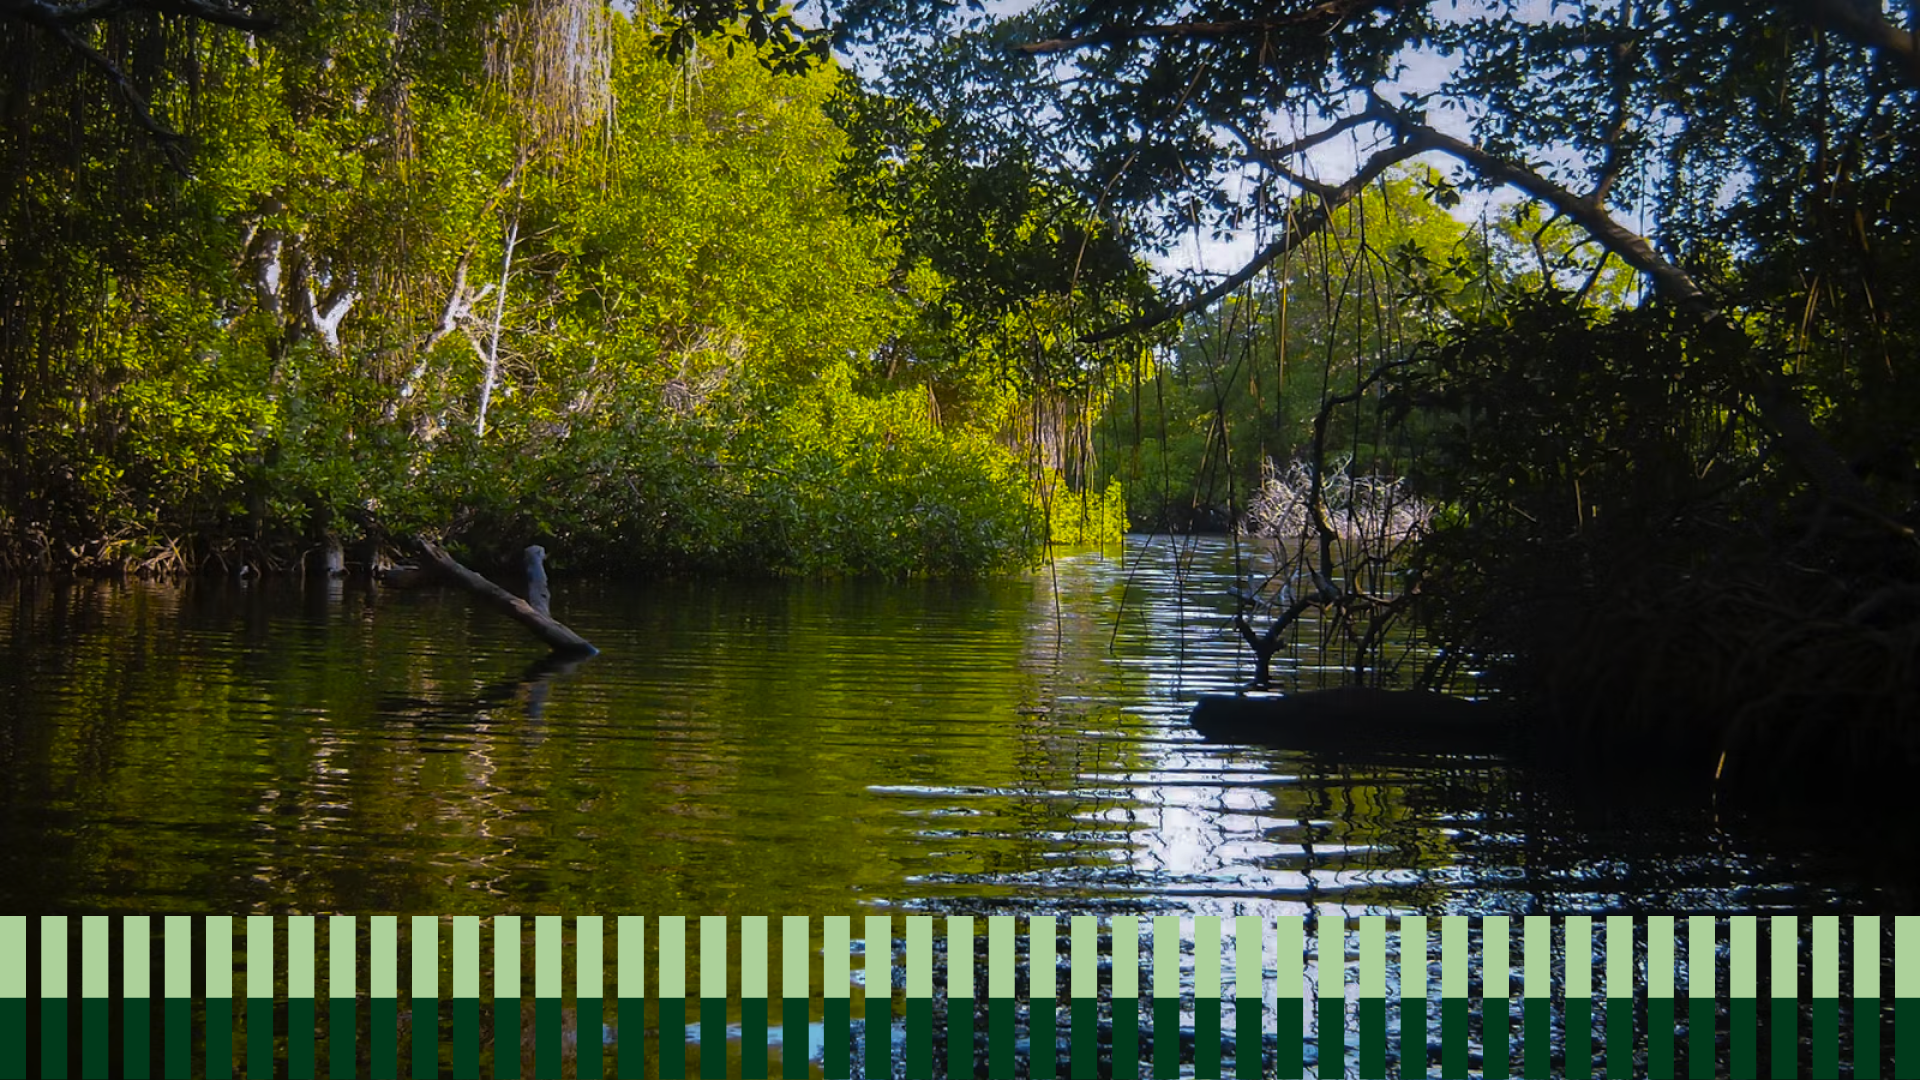
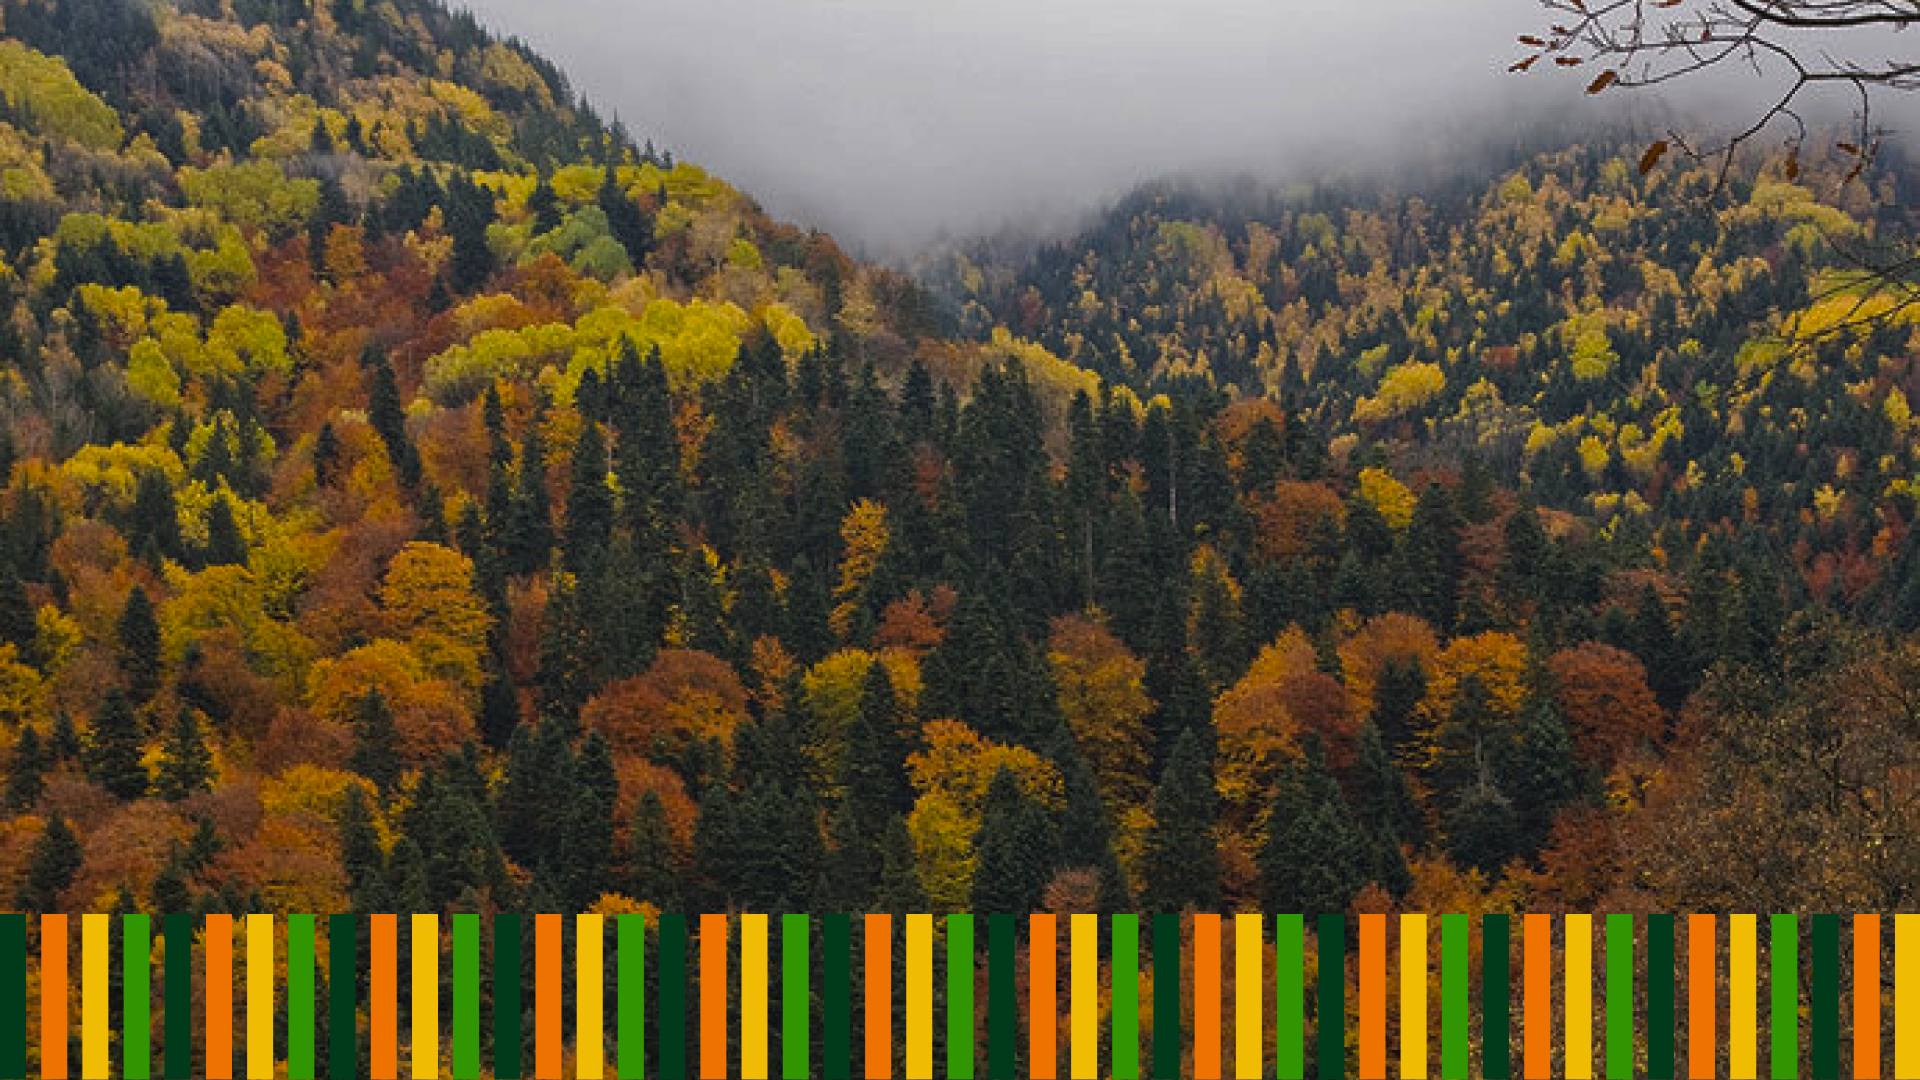
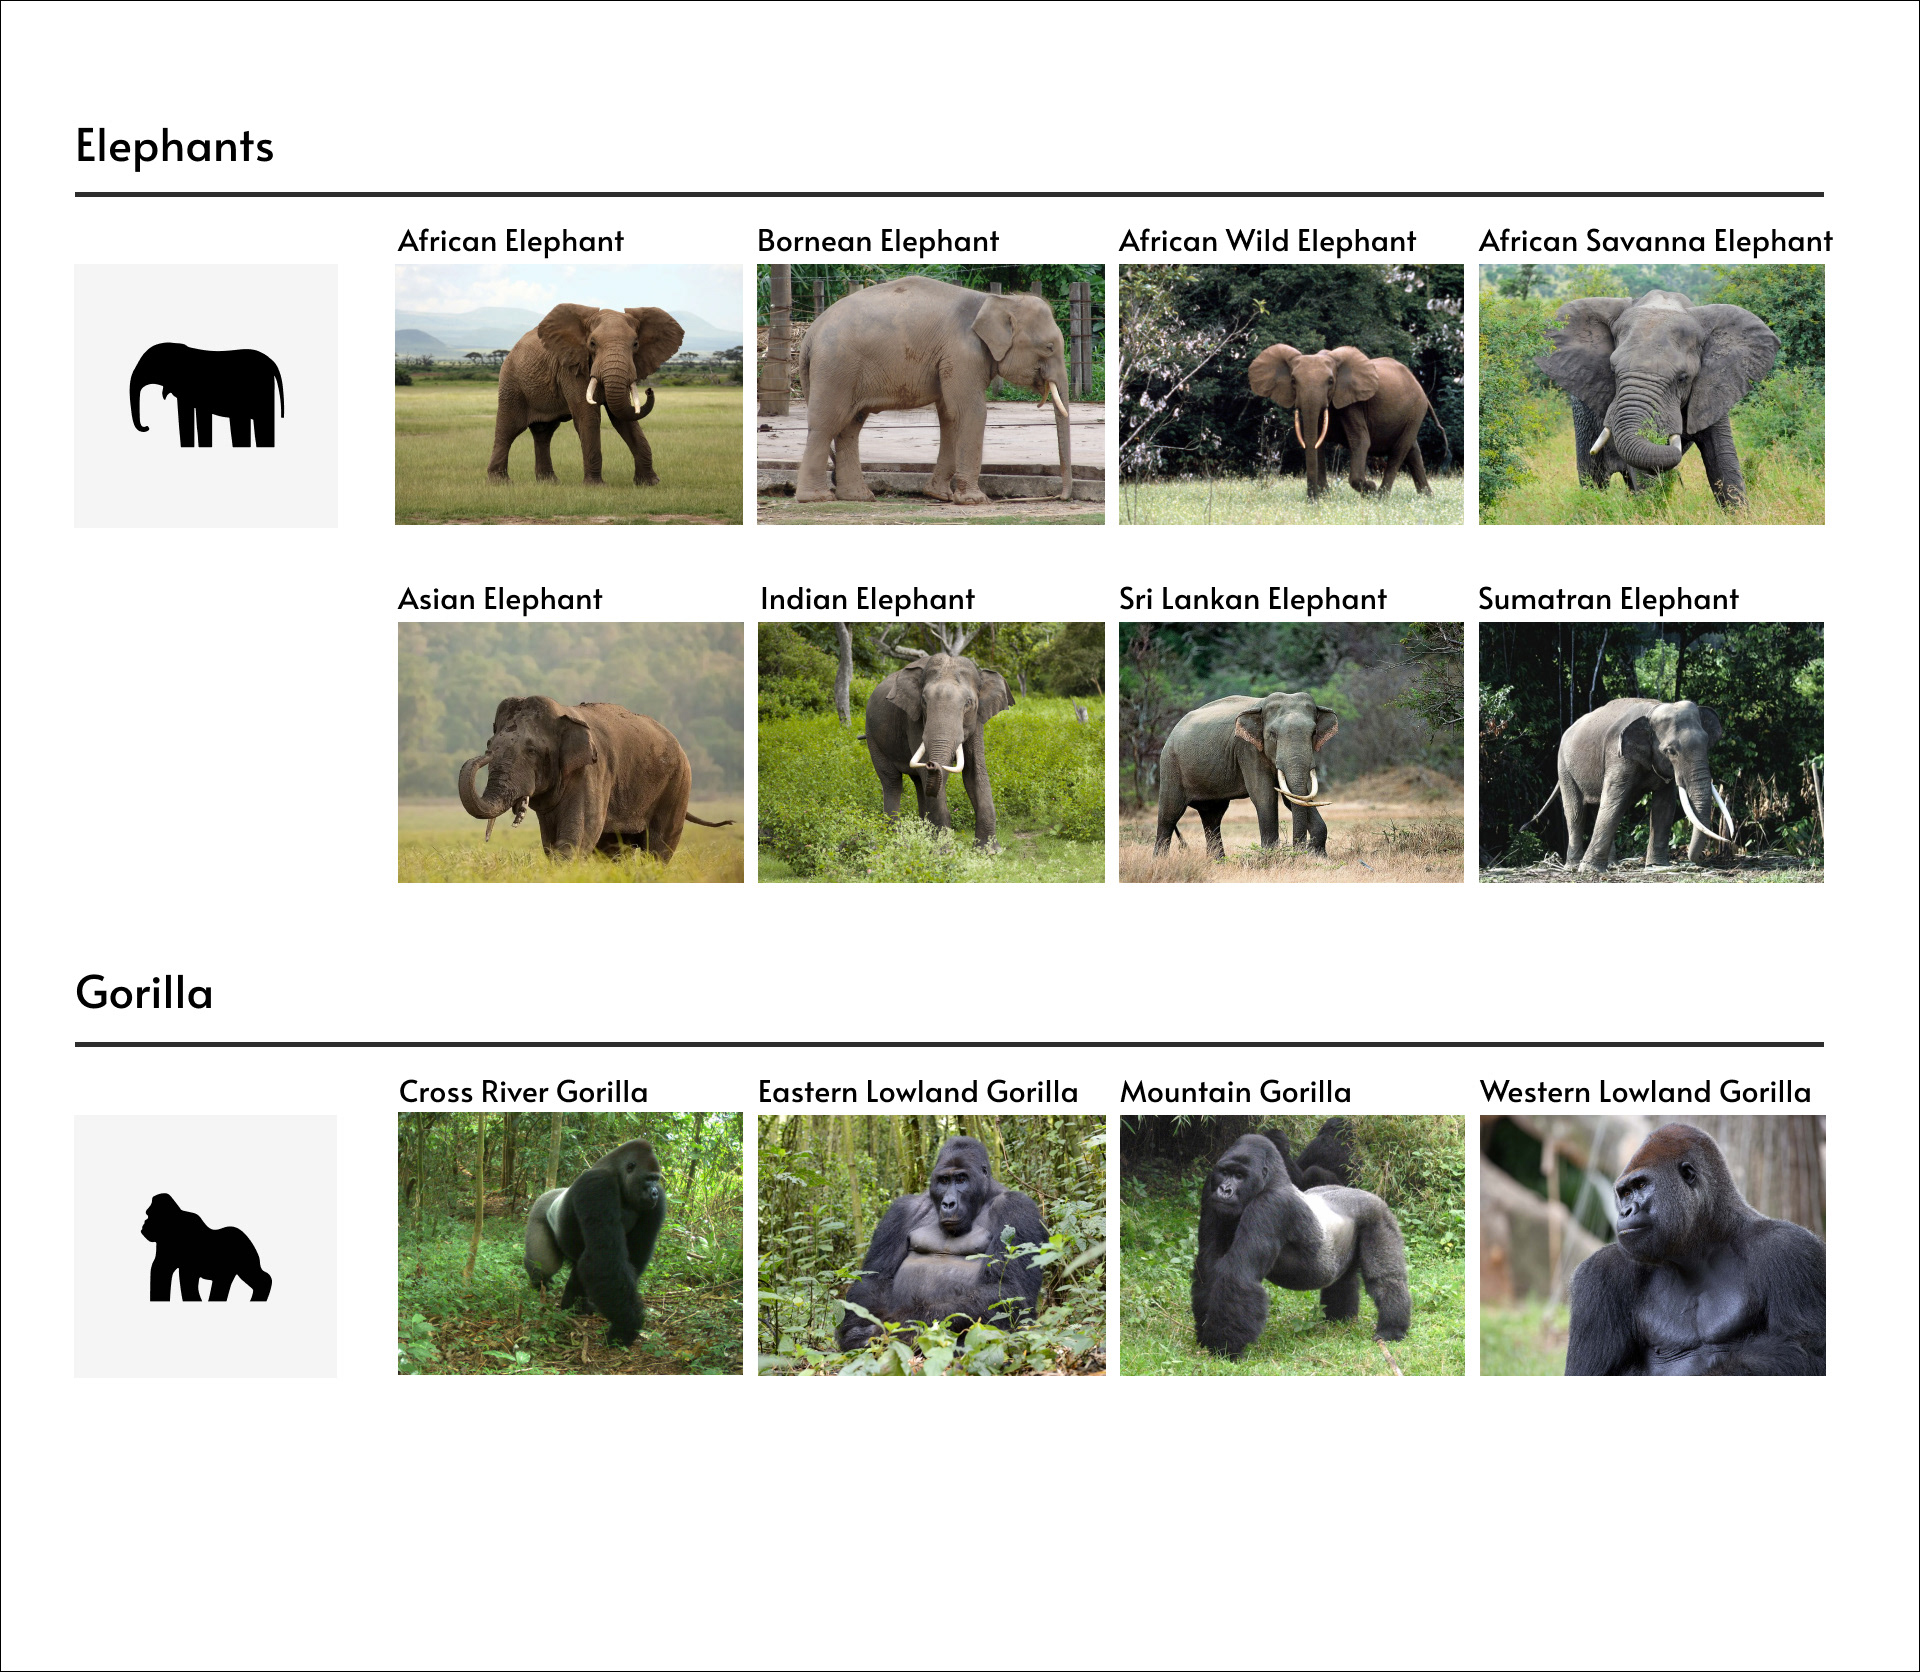
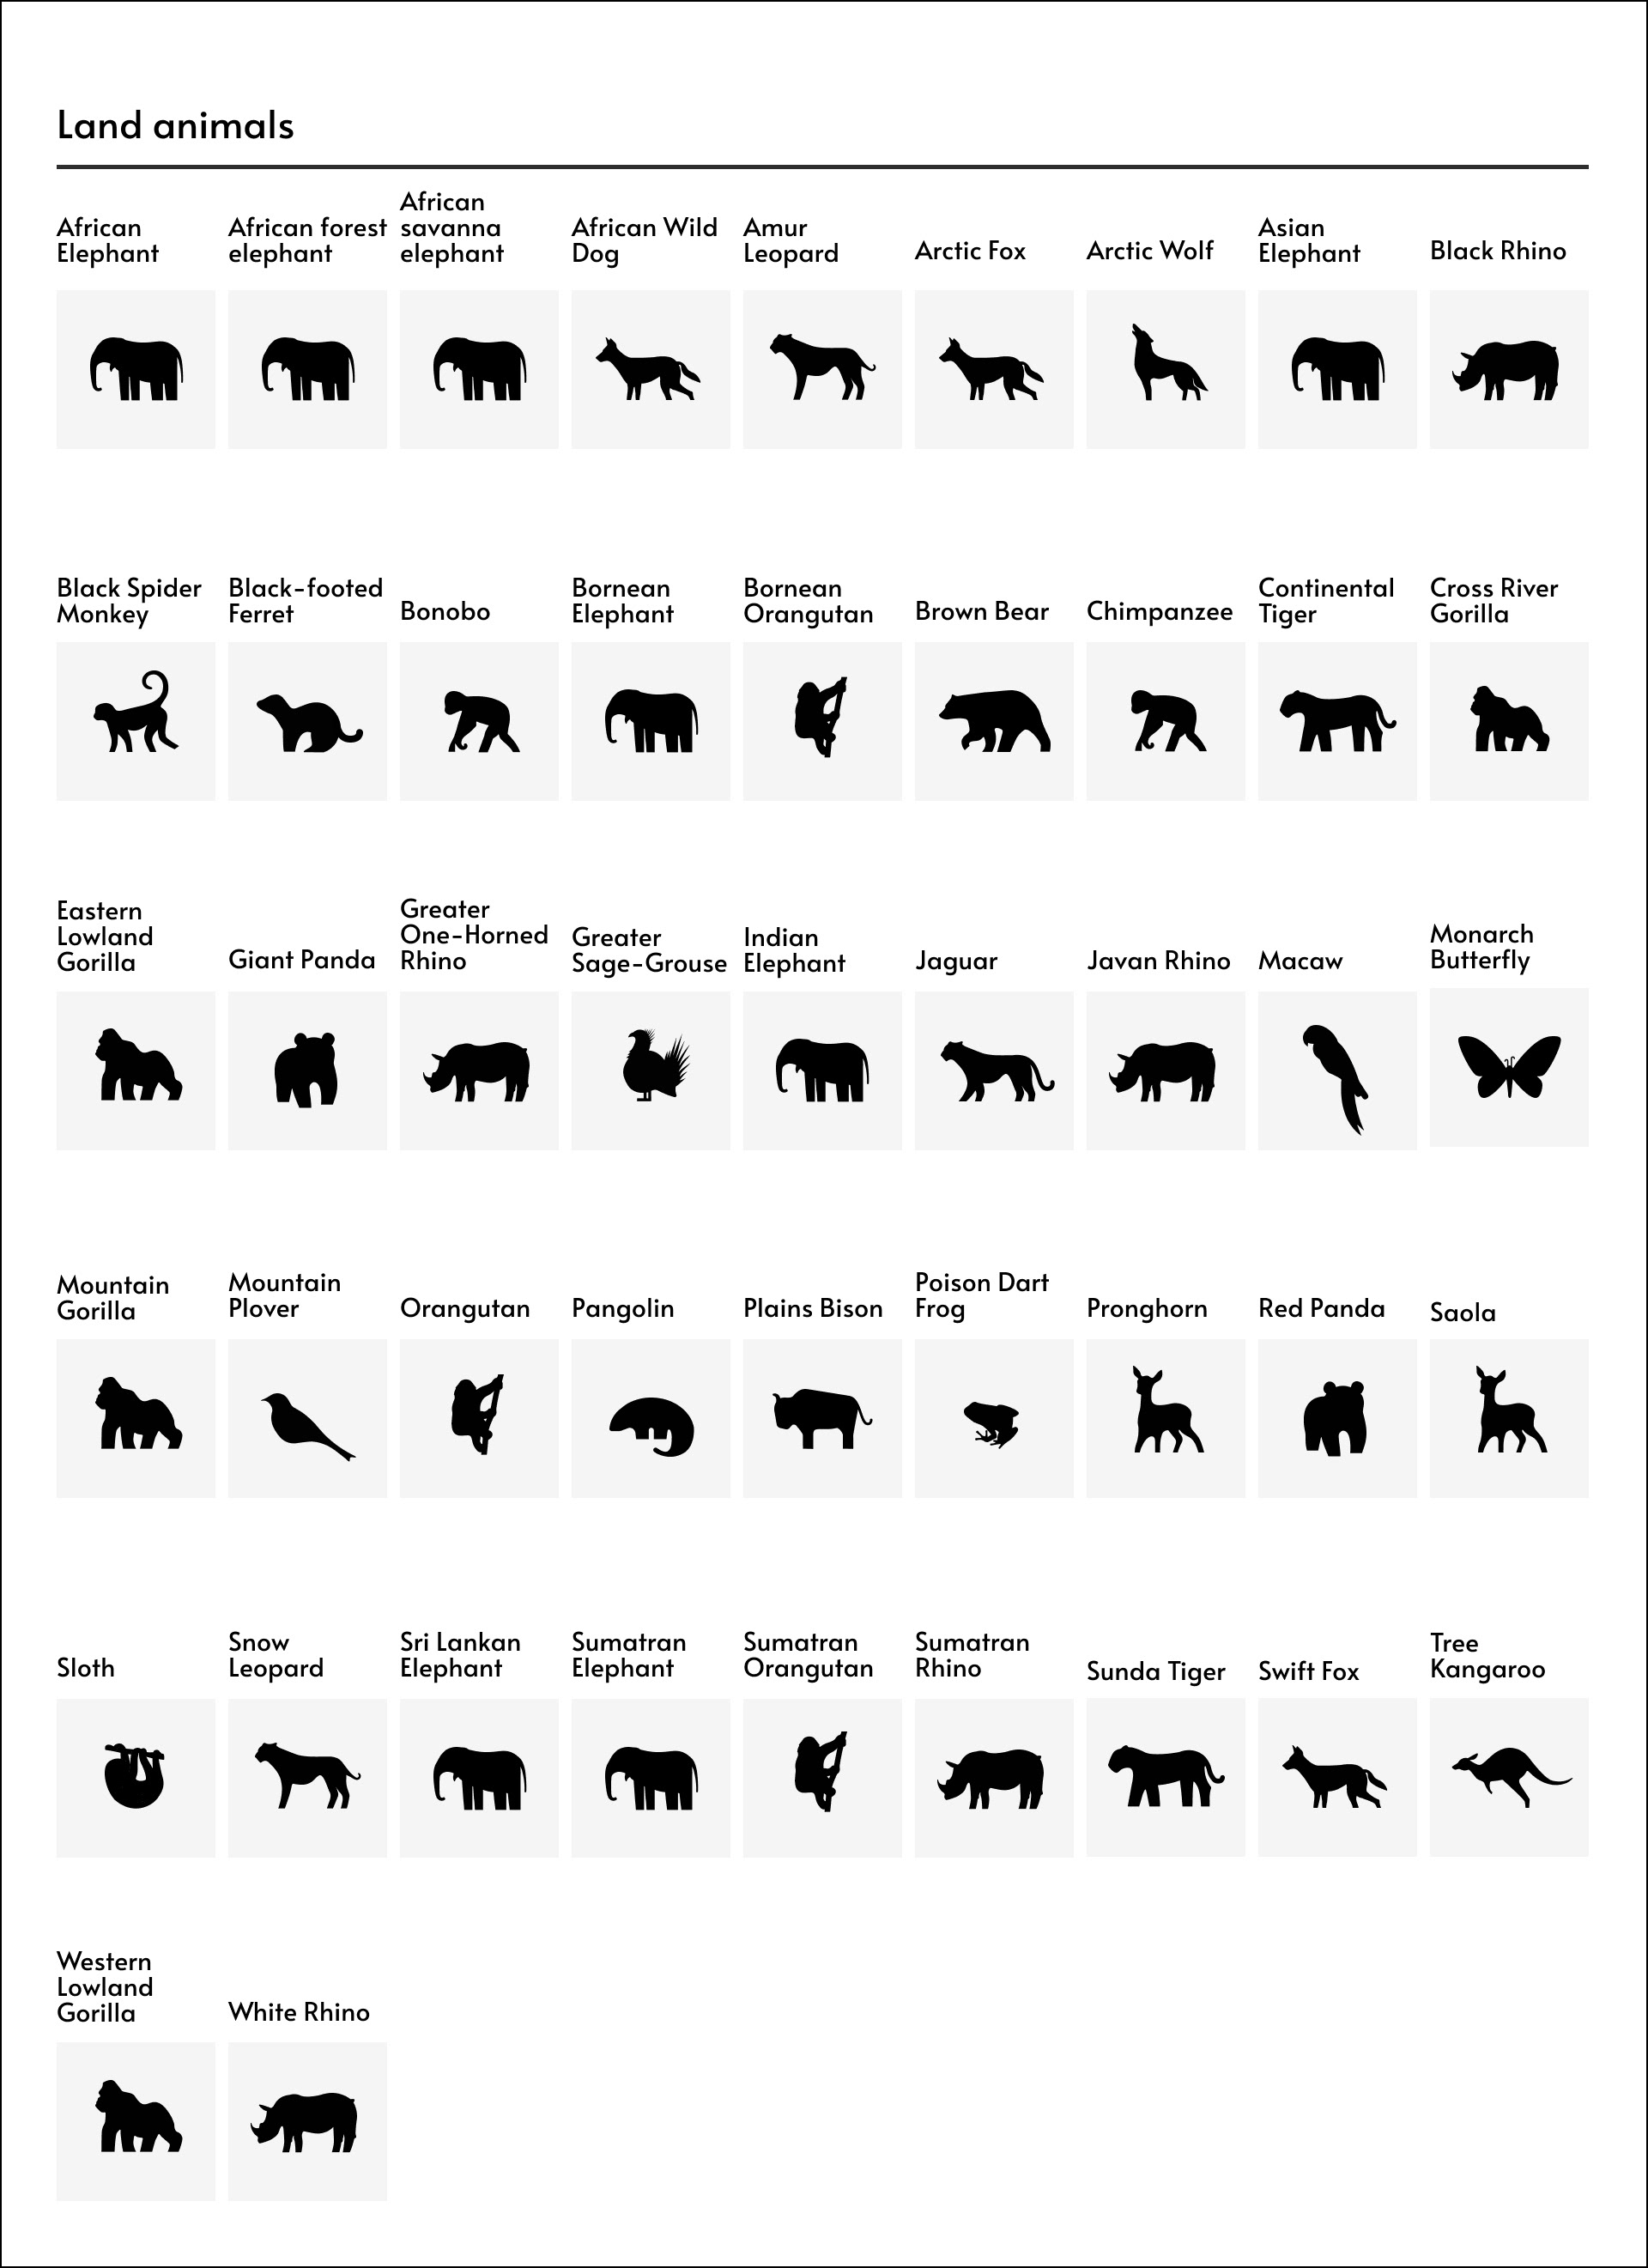
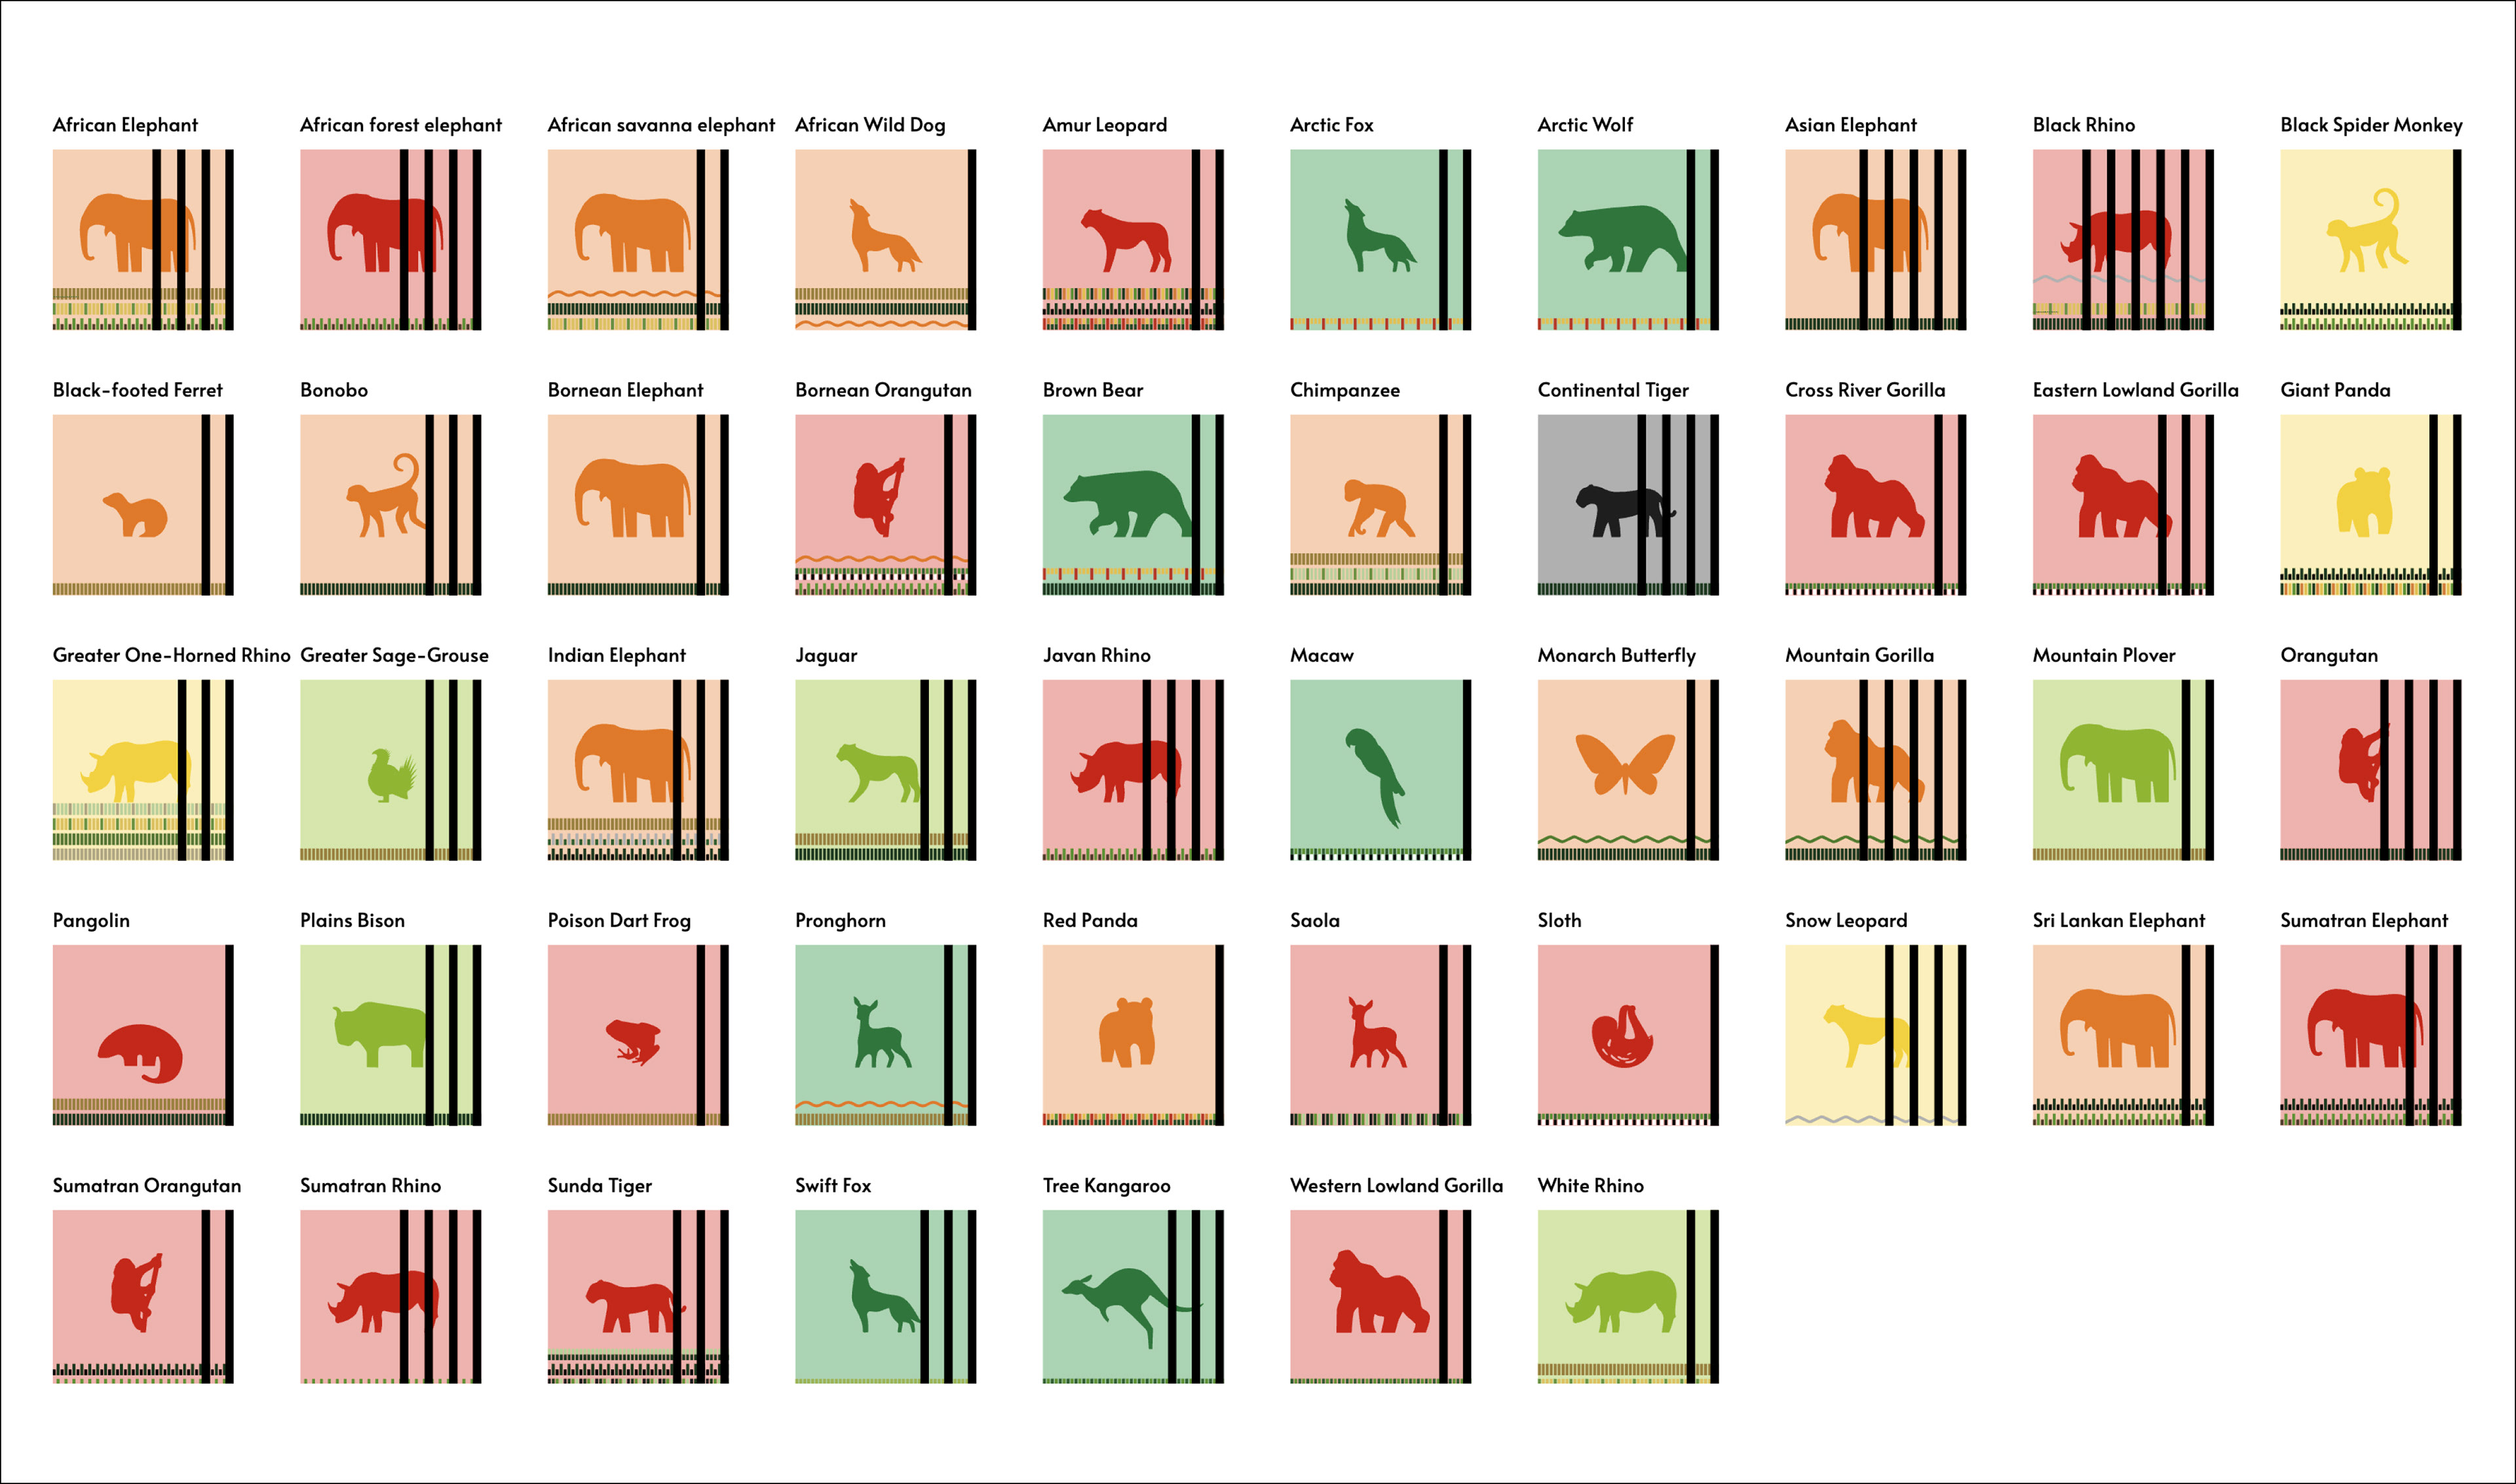
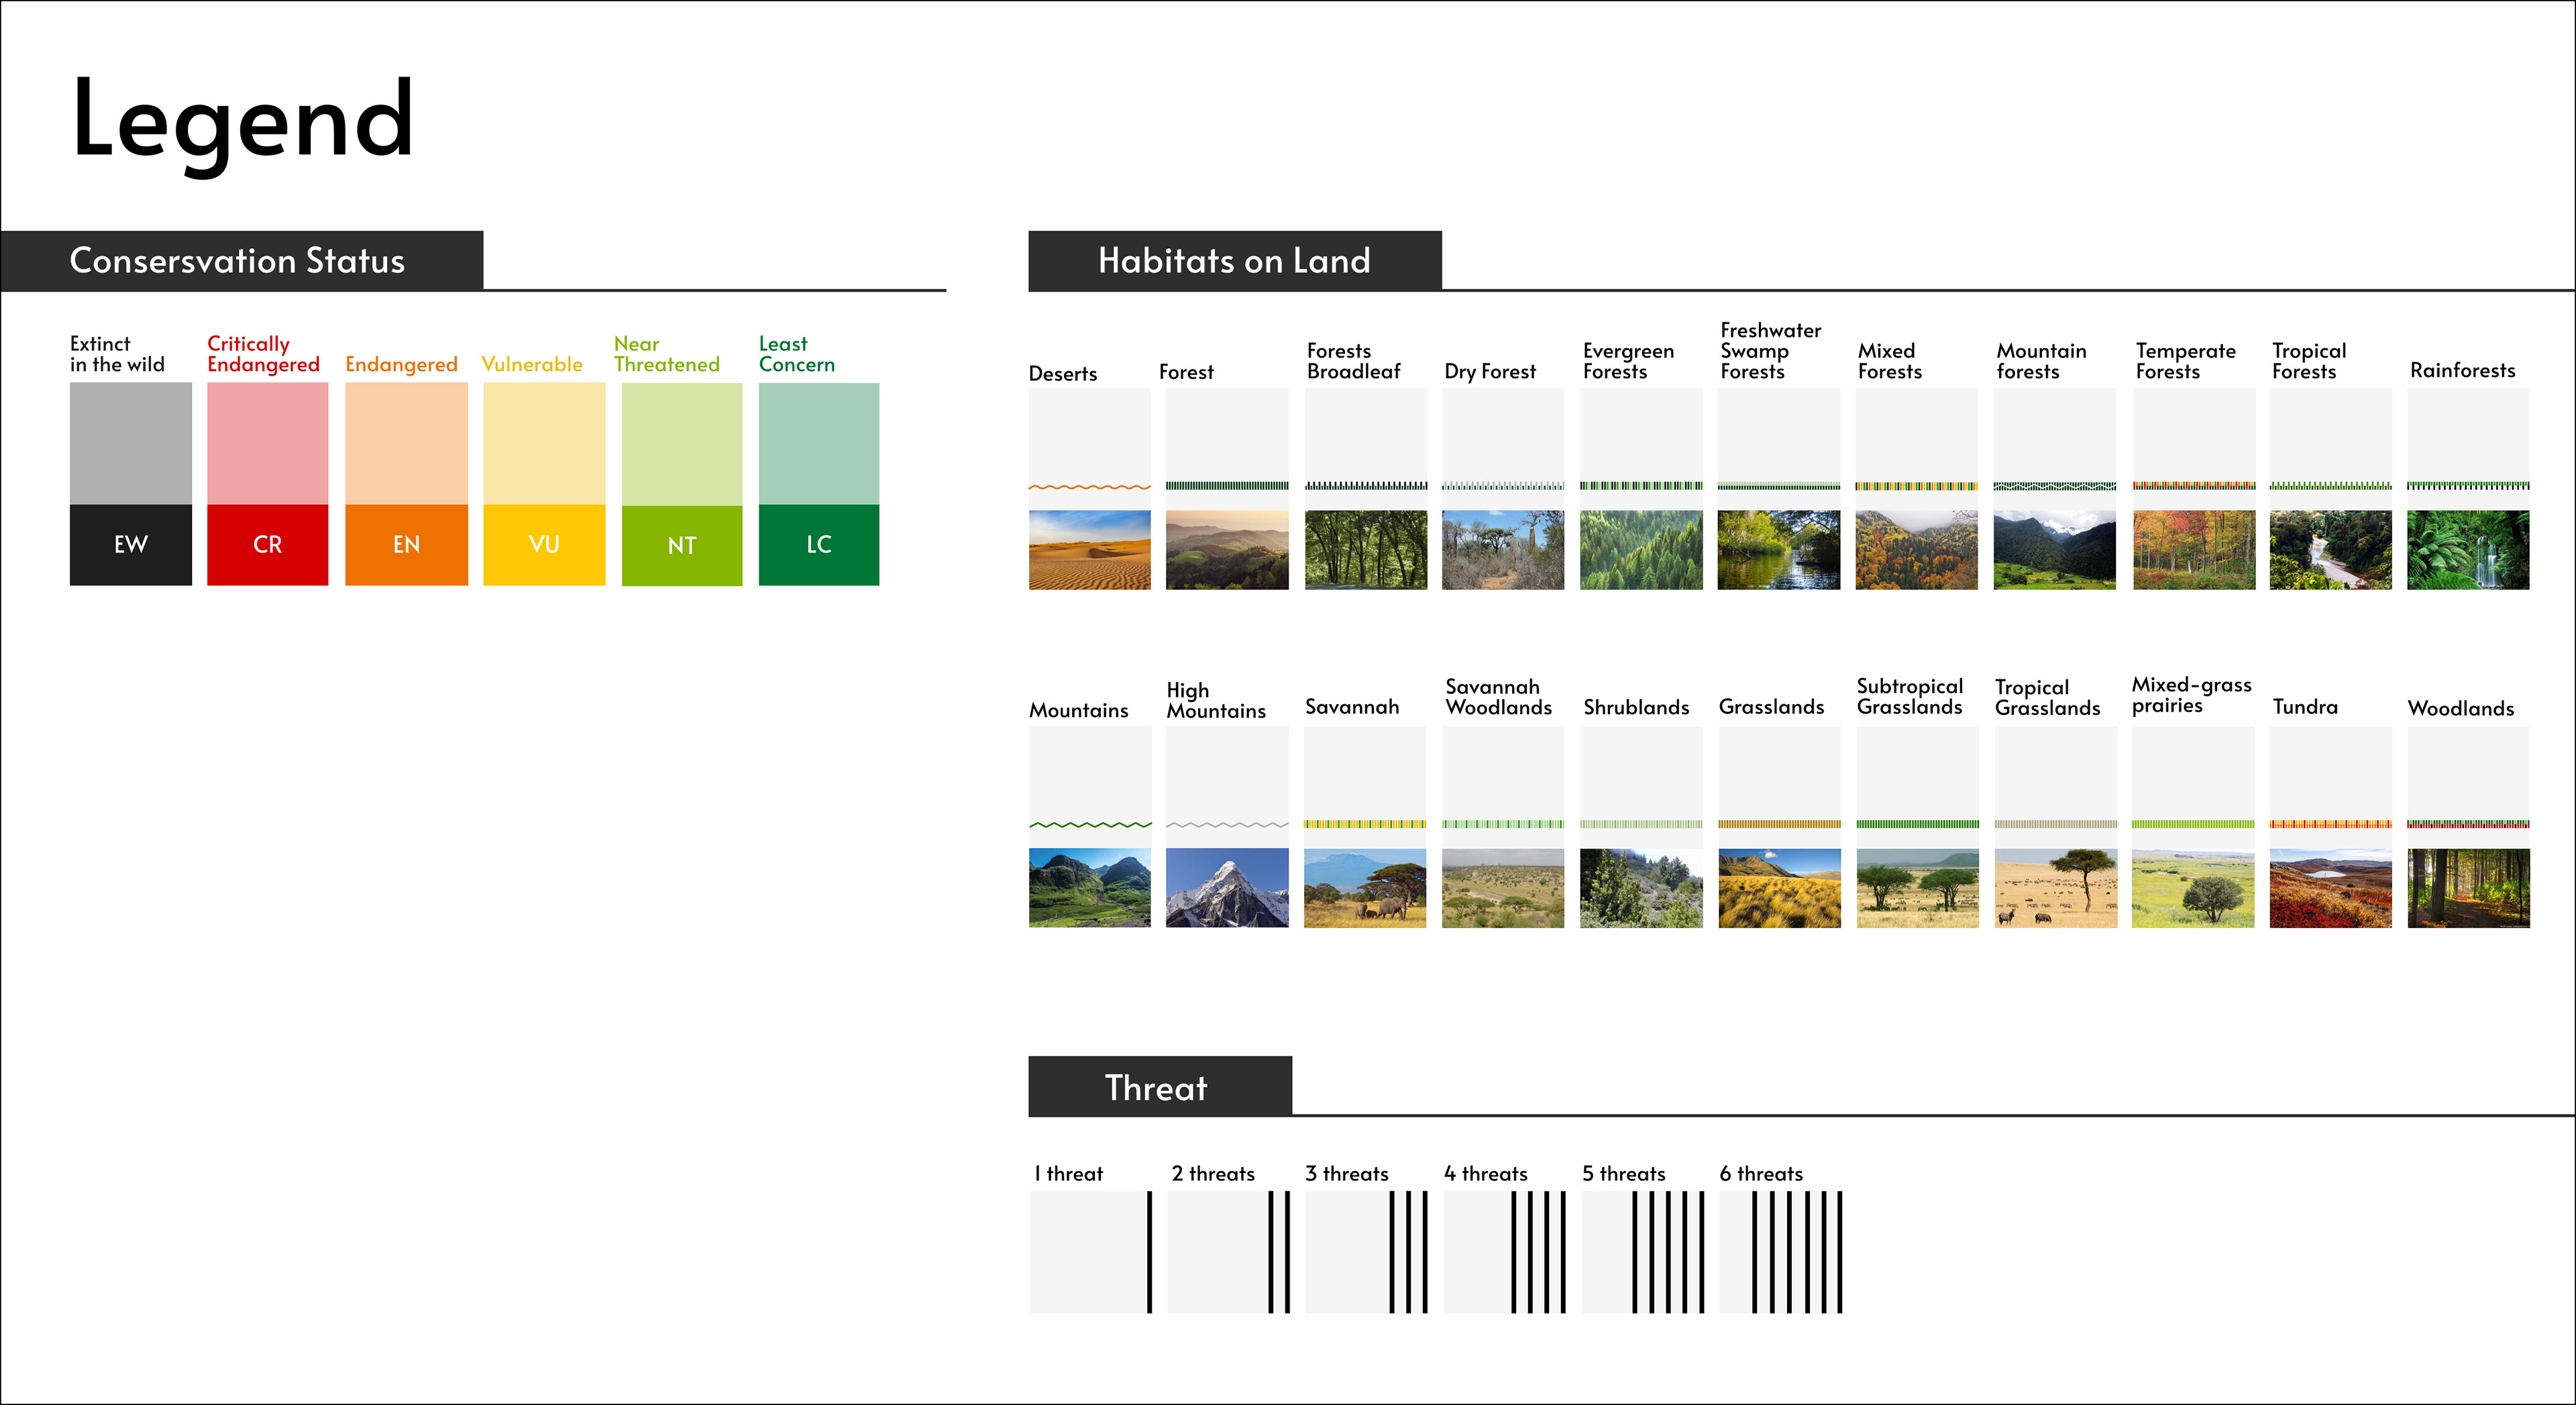
I created a habitat legend using lines and rectangles that can be easily transformed into scalable vector graphics (SVGs). Each habitat was designed based on its natural environment. However, because each animal has a unique appearance, having too many icons can be confusing. To address this, I grouped animals by species. For example, African and Bornean elephants share the same elephant icon, despite differences in ear size. This resulted in a total of 23 SVGs. The use of simple shapes and colors effectively conveys complex information in a clear and visually appealing way.
Threats are represented by a long black horizontal line, inspired by animal cages in a zoo. In this visualization, I aimed to communicate four variables: the type of animal, its conservation status, its habitat, and the number of threats it faces.
Note: Photographs are for reference purposes only and were sourced from the internet. I do not claim ownership or authorship of these photographs.
Outcome
I have used JavaScript and D3.js to link the data points with the visual elements. As a self-taught coder, there are still some elements that are not displaying exactly as I intend, but so far this is how the visual looks.
One of the interesting insights that emerges from this visualisation is that some animals have four or more threats but are not yet critically endangered, such as the African elephant, Mountain Gorilla, and Snow Leopard. Conversely, some animals that have only one threat can be critically endangered, such as the Pangolin, Saola, and Sloth. Additionally, the visualisation reveals that some animals can be found in multiple habitats while others are limited to just one habitat.
This work is a part of MS Data Visualisation course at Parson school of Design - fall semester 2022.